Quantcast
Channel: Severalnines - MariaDB
Viewing all 327 articles
Browse latest View live

How to Protect your MySQL or MariaDB Database From SQL Injection: Part Two

$
0
0

In the first part of this blog we described how ProxySQL can be used to block incoming queries that were deemed dangerous. As you saw in that blog, achieving this is very easy. This is not a full solution, though. You may need to design an even more tightly secured setup - you may want to block all of the queries and then allow just some select ones to pass through. It is possible to use ProxySQL to accomplish that. Let’s take a look at how it can be done.

There are two ways to implement whitelist in ProxySQL. First, the historical one, would be to create a catch-all rule that will block all the queries. It should be the last query rule in the chain. An example below:

We are matching every string and generate an error message. This is the only rule existing at this time, it prevents any query from being executed.

mysql> USE sbtest;

Database changed

mysql> SELECT * FROM sbtest1 LIMIT 10;

ERROR 1148 (42000): This query is not on the whitelist, you have to create a query rule before you'll be able to execute it.

mysql> SHOW TABLES FROM sbtest;

ERROR 1148 (42000): This query is not on the whitelist, you have to create a query rule before you'll be able to execute it.

mysql> SELECT 1;

ERROR 1148 (42000): This query is not on the whitelist, you have to create a query rule before you'll be able to execute it.

As you can see, we can’t run any queries. In order for our application to work we would have to create query rules for all of the queries that we want to allow to execute. It can be done per query, based on the digest or pattern. You can also allow traffic based on the other factors: username, client host, schema. Let’s allow SELECTs to one of the tables:

Now we can execute queries on this table, but not on any other:

mysql> SELECT id, k FROM sbtest1 LIMIT 2;

+------+------+

| id   | k |

+------+------+

| 7615 | 1942 |

| 3355 | 2310 |

+------+------+

2 rows in set (0.01 sec)

mysql> SELECT id, k FROM sbtest2 LIMIT 2;

ERROR 1148 (42000): This query is not on the whitelist, you have to create a query rule before you'll be able to execute it.

The problem with this approach is that it is not efficiently handled in ProxySQL, therefore in ProxySQL 2.0.9 comes with new mechanism of firewalling which includes new algorithm, focused on this particular use case and as such more efficient. Let’s see how we can use it.

First, we have to install ProxySQL 2.0.9. You can download packages manually from https://github.com/sysown/proxysql/releases/tag/v2.0.9 or you can set up the ProxySQL repository.


Once this is done, we can start looking into it and try to configure it to use SQL firewall. 

The process itself is quite easy. First of all, you have to add a user to the mysql_firewall_whitelist_users table. It contains all the users for which firewall should be enabled.

mysql> INSERT INTO mysql_firewall_whitelist_users (username, client_address, mode, comment) VALUES ('sbtest', '', 'DETECTING', '');

Query OK, 1 row affected (0.00 sec)

mysql> LOAD MYSQL FIREWALL TO RUNTIME;

Query OK, 0 rows affected (0.00 sec)

In the query above we added ‘sbtest’ user to the list of users which should have firewall enabled. It is possible to tell that only connections from a given host are tested against the firewall rules. You can also have three modes: ‘OFF’, when firewall is not used, ‘DETECTING’, where incorrect queries are logged but not blocked and ‘PROTECTING’, where not allowed queries will not be executed.

Let’s enable our firewall:

mysql> SET mysql-firewall_whitelist_enabled=1;

Query OK, 1 row affected (0.00 sec)

mysql> LOAD MYSQL VARIABLES TO RUNTIME;

Query OK, 0 rows affected (0.00 sec)

ProxySQL firewall bases on the digest of the queries, it does not allow for regular expressions to be used. The best way to collect data about which queries should be allowed is to use stats.stats_mysql_query_digest table, where you can collect queries and their digests. On top of that, ProxySQL 2.0.9 comes with a new table: history_mysql_query_digest, which is an persistent extension to the previously mentioned in-memory table. You can configure ProxySQL to store data on disk from time to time:

mysql> SET admin-stats_mysql_query_digest_to_disk=30;

Query OK, 1 row affected (0.00 sec)

Every 30 seconds data about queries will be stored on disk. Let’s see how it goes. We’ll execute couple of queries and then check their digests:

mysql> SELECT schemaname, username, digest, digest_text FROM history_mysql_query_digest;

+------------+----------+--------------------+-----------------------------------+

| schemaname | username | digest             | digest_text |

+------------+----------+--------------------+-----------------------------------+

| sbtest     | sbtest | 0x76B6029DCBA02DCA | SELECT id, k FROM sbtest1 LIMIT ? |

| sbtest     | sbtest | 0x1C46AE529DD5A40E | SELECT ?                          |

| sbtest     | sbtest | 0xB9697893C9DF0E42 | SELECT id, k FROM sbtest2 LIMIT ? |

+------------+----------+--------------------+-----------------------------------+

3 rows in set (0.00 sec)

As we set the firewall to ‘DETECTING’ mode, we’ll also see entries in the log:

2020-02-14 09:52:12 Query_Processor.cpp:2071:process_mysql_query(): [WARNING] Firewall detected unknown query with digest 0xB9697893C9DF0E42 from user sbtest@10.0.0.140

2020-02-14 09:52:17 Query_Processor.cpp:2071:process_mysql_query(): [WARNING] Firewall detected unknown query with digest 0x76B6029DCBA02DCA from user sbtest@10.0.0.140

2020-02-14 09:52:20 Query_Processor.cpp:2071:process_mysql_query(): [WARNING] Firewall detected unknown query with digest 0x1C46AE529DD5A40E from user sbtest@10.0.0.140

Now, if we want to start blocking queries, we should update our user and set the mode to ‘PROTECTING’. This will block all the traffic so let’s start by whitelisting queries above. Then we’ll enable the ‘PROTECTING’ mode:

mysql> INSERT INTO mysql_firewall_whitelist_rules (active, username, client_address, schemaname, digest, comment) VALUES (1, 'sbtest', '', 'sbtest', '0x76B6029DCBA02DCA', ''), (1, 'sbtest', '', 'sbtest', '0xB9697893C9DF0E42', ''), (1, 'sbtest', '', 'sbtest', '0x1C46AE529DD5A40E', '');

Query OK, 3 rows affected (0.00 sec)

mysql> UPDATE mysql_firewall_whitelist_users SET mode='PROTECTING' WHERE username='sbtest' AND client_address='';

Query OK, 1 row affected (0.00 sec)

mysql> LOAD MYSQL FIREWALL TO RUNTIME;

Query OK, 0 rows affected (0.00 sec)

mysql> SAVE MYSQL FIREWALL TO DISK;

Query OK, 0 rows affected (0.08 sec)

That’s it. Now we can execute whitelisted queries:

mysql> SELECT id, k FROM sbtest1 LIMIT 2;

+------+------+

| id   | k |

+------+------+

| 7615 | 1942 |

| 3355 | 2310 |

+------+------+

2 rows in set (0.00 sec)

But we cannot execute non-whitelisted ones:

mysql> SELECT id, k FROM sbtest3 LIMIT 2;

ERROR 1148 (42000): Firewall blocked this query

ProxySQL 2.0.9 comes with yet another interesting security feature. It has embedded libsqlinjection and you can enable the detection of possible SQL injections. Detection is based on the algorithms from the libsqlinjection. This feature can be enabled by running:

mysql> SET mysql-automatic_detect_sqli=1;

Query OK, 1 row affected (0.00 sec)

mysql> LOAD MYSQL VARIABLES TO RUNTIME;

Query OK, 0 rows affected (0.00 sec)

It works with the firewall in a following way:

  • If the firewall is enabled and the user is in PROTECTING mode, SQL injection detection is not used as only explicitly whitelisted queries can pass through.
  • If the firewall is enabled and the user is in DETECTING mode, whitelisted queries are not tested for SQL injection, all others will be tested.
  • If the firewall is enabled and the user is in ‘OFF’ mode, all queries are assumed to be whitelisted and none will be tested for SQL injection.
  • If the firewall is disabled, all queries will be tested for SQL intection.

Basically, it is used only if the firewall is disabled or for users in ‘DETECTING’ mode. SQL injection detection, unfortunately, comes with quite a lot of false positives. You can use table mysql_firewall_whitelist_sqli_fingerprints to whitelist fingerprints for queries which were detected incorrectly. Let’s see how it works. First, let’s disable firewall:

mysql> set mysql-firewall_whitelist_enabled=0;

Query OK, 1 row affected (0.00 sec)

mysql> LOAD MYSQL VARIABLES TO RUNTIME;

Query OK, 0 rows affected (0.00 sec)

Then, let’s run some queries.

mysql> SELECT id, k FROM sbtest2 LIMIT 2;

ERROR 2013 (HY000): Lost connection to MySQL server during query

Indeed, there are false positives. In the log we could find:

2020-02-14 10:11:19 MySQL_Session.cpp:3393:handler(): [ERROR] SQLinjection detected with fingerprint of 'EnknB' from client sbtest@10.0.0.140 . Query listed below:

SELECT id, k FROM sbtest2 LIMIT 2

Ok, let’s add this fingerprint to the whitelist table:

mysql> INSERT INTO mysql_firewall_whitelist_sqli_fingerprints VALUES (1, 'EnknB');

Query OK, 1 row affected (0.00 sec)

mysql> LOAD MYSQL FIREWALL TO RUNTIME;

Query OK, 0 rows affected (0.00 sec)

Now we can finally execute this query:

mysql> SELECT id, k FROM sbtest2 LIMIT 2;

+------+------+

| id   | k |

+------+------+

|   84 | 2456 |

| 6006 | 2588 |

+------+------+

2 rows in set (0.01 sec)

We tried to run sysbench workload, this resulted in two more fingerprints added to the whitelist table:

2020-02-14 10:15:55 MySQL_Session.cpp:3393:handler(): [ERROR] SQLinjection detected with fingerprint of 'Enknk' from client sbtest@10.0.0.140 . Query listed below:

SELECT c FROM sbtest21 WHERE id=49474

2020-02-14 10:16:02 MySQL_Session.cpp:3393:handler(): [ERROR] SQLinjection detected with fingerprint of 'Ef(n)' from client sbtest@10.0.0.140 . Query listed below:

SELECT SUM(k) FROM sbtest32 WHERE id BETWEEN 50053 AND 50152

We wanted to see if this automated SQL injection can protect us against our good friend, Booby Tables.

mysql> CREATE TABLE school.students (id INT, name VARCHAR(40));

Query OK, 0 rows affected (0.07 sec)

mysql> INSERT INTO school.students VALUES (1, 'Robert');DROP TABLE students;--

Query OK, 1 row affected (0.01 sec)

Query OK, 0 rows affected (0.04 sec)

mysql> SHOW TABLES FROM school;

Empty set (0.01 sec)

Unfortunately, not really. Please keep in mind this feature is based on automated forensic algorithms, it is far from perfect. It may come as an additional layer of defence but it will never be able to replace properly maintained firewall created by someone who knows the application and its queries.

We hope that after reading this short, two-part series you have a better understanding of how you can protect your database against SQL injection and malicious attempts (or just plainly user errors) using ProxySQL. If you have more ideas, we’d love to hear from you in the comments.


How to Protect Your MySQL & MariaDB Database Against Cyberattacks When on a Public Network

$
0
0

It is sometimes inevitable to run MySQL database servers on a public or exposed network. This is a common setup in a shared hosting environment, where a server is configured with multiple services and often running within the same server as the database server. For those who have this kind of setup, you should always have some kind of protection against cyberattacks like denial-of-service, hacking, cracking, data breaches; all which can result in data loss. These are things that we always want to avoid for our database server. 

Here are some of the tips that we can do to improve our MySQL or MariaDB security.

Scan Your Database Servers Regularly

Protection against any malicious files in the server is very critical. Scan the server regularly to look for any viruses, spywares, malwares or rootkits especially if the database server is co-located with other services like mail server, HTTP, FTP, DNS, WebDAV, telnet and so on. Commonly, most of the database hacked issues originated from the application tier that is facing the public network. Thus, it's important to scan all files, especially web/application files since they are one of the entry points to get into the server. If those are compromised, the hacker can get into the application directory, and have the ability to read the application files. These might contain sensitive information, for instance, the database login credentials. 

ClamAV is one of the most widely known and widely trusted antivirus solutions for a variety of operating systems, including Linux. It's free and very easy to install and comes with a fairly good detection mechanism to look for unwanted things in your server. Schedule periodic scans in the cron job, for example:

0 3 * * * /bin/freshclam ; /bin/clamscan / --recursive=yes -i > /tmp/clamav.log ; mail -s clamav_log_`hostname` monitor@mydomain.local < /tmp/clamav.log

The above will update the ClamAV virus database, scan all directories and files and send you an email on the status of the execution and report every day at 3 AM.

Use Stricter User Roles and Privileges

When creating a MySQL user, do not allow all hosts to access the MySQL server with wildcard host (%). You should scan your MySQL host and look for any wildcard host value, as shown in the following statement:

mysql> SELECT user,host FROM mysql.user WHERE host = '%';
+---------+------+
| user    | host |
+---------+------+
| myadmin | %    |
| sbtest  | %    |
| user1   | %    |
+---------+------+

From the above output, strict or remove all users that have only '%' value under Host column. Users that need to access the MySQL server remotely can be enforced to use SSH tunnelling method, which does not require remote host configuration for MySQL users. Most of the MySQL administration clients such as MySQL Workbench and HeidiSQL can be configured to connect to a MySQL server via SSH tunelling, therefore it's possible to completely eliminate remote connection for MySQL users.

Also, limit the SUPER privilege to only users from localhost, or connecting via UNIX socket file. Be more cautious when assigning FILE privilege to non-root users since it permits read and write files on the server using theLOAD DATA INFILE and SELECT ... INTO OUTFILE statements. Any user to whom this privilege is granted can also read or write any file that the MySQL server can read or write.

Change the Database Default Settings

By moving away from the default setup, naming and configurations, we can reduce the attack vector to a number of folds. The following actions are some examples on default configurations that DBAs could easily change but commonly overlooked related to MySQL:

  • Change default MySQL port to other than 3306.
  • Rename the MySQL root username to other than "root".
  • Enforce password expiration and reduce the password lifetime for all users.
  • If MySQL is co-located with the application servers, enforce connection through UNIX socket file only, and stop listening on port 3306 for all IP addresses.
  • Enforce client-server encryption and server-server replication encryption.

We actually have covered this in detail in this blog post, How to Secure MySQL/MariaDB Servers.

Setup a Delayed Slave

A delayed slave is just a typical slave, however the slave server intentionally executes transactions later than the master by at least a specified amount of time, available from MySQL 5.6. Basically, an event received from the master is not executed until at least N seconds later than its execution on the master. The result is that the slave will reflect the state of the master some time back in the past.

A delayed slave can be used to recover data, which would be helpful when the problem is found immediately, within the period of delay. Suppose we configured a slave with a 6-hour delay from the master. If our database were modified or deleted (accidentally by a developer or deliberately by a hacker) within this time range, there is a possibility for us to revert to the moment right before it happened by stopping the current master, then bringing the slave server up until certain point with the following command:

# on delayed slave
mysql> STOP SLAVE;
mysql> START SLAVE UNTIL MASTER_LOG_FILE='xxxxx', MASTER_LOG_POS=yyyyyy;

Where 'xxxxx' is the binary log file and 'yyyyy' is the position right before the disaster happens (use mysqlbinlog tool to examine those events). Finally, promote the slave to become the new master and your MySQL service is now back operational as usual. This method is probably the fastest way to recover your MySQL database in production environment without having to reload a backup. Having a number of delayed slaves with different length durations, as shown in this blog, Multiple Delayed Replication Slaves for Disaster Recovery with Low RTO on how to set up a cost-effective delayed replication servers on top of Docker containers.

Enable Binary Logging

Binary logging is generally recommended to be enabled even though you are running on a standalone MySQL/MariaDB server. The binary log contains information about SQL statements that modify database contents. The information is stored in the form of "events" that describe the modifications. Despite performance impact, having binary log allows you to have the possibility to replay your database server to the exact point where you want it to be restored, also known as point-in-time recovery (PITR). Binary logging is also mandatory for replication. 

With binary logging enabled, one has to include the binary log file and position information when taking up a full backup. For mysqldump, using the --master-data flag with value 1 or 2 will print out the necessary information that we can use as a starting point to roll forward the database when replaying the binary logs later on. 

With binary logging enabled, you can use another cool recovery feature called flashback, which is described in the next section.

Enable Flashback

The flashback feature is available in MariaDB, where you can restore back the data to the previous snapshot in a MySQL database or in a table. Flashback uses the mysqlbinlog to create the rollback statements and it needs a FULL binary log row image for that. Thus, to use this feature, the MySQL/MariaDB server must be configured with the following:

[mysqld]
...
binlog_format = ROW
binlog_row_image = FULL

The following architecture diagram illustrates how flashback is configured on one of the slave:

To perform the flashback operation, firstly you have to determine the date and time when you want to "see" the data, or binary log file and position. Then, use the --flashback flag with mysqlbinlog utility to generate SQL statements to rollback the data to that point. In the generated SQL file, you will notice that the DELETE events are converted to INSERTs and vice versa, and also it swaps WHERE and SET parts of the UPDATE events. 

The following command line should be executed on the slave2 (configured with binlog_row_image=FULL):

$ mysqlbinlog --flashback --start-datetime="2020-02-17 01:30:00"  /var/lib/mysql/mysql-bin.000028 -v --database=shop --table=products > flashback_to_2020-02-17_013000.sql

Then, detach slave2 from the replication chain because we are going to break it and use the server to rollback our data:

mysql> STOP SLAVE;
mysql> RESET MASTER;
mysql> RESET SLAVE ALL;

Finally, import the generated SQL file into the MariaDB server for database shop on slave2:

$ mysql -u root -p shop < flashback_to_2020-02-17_013000.sql

When the above is applied, the table "products" will be at the state of 2020-02-17 01:30:00. Technically, the generated SQL file can be applied to both MariaDB and MySQL servers. You could also transfer the mysqlbinlog binary from MariaDB server so you can use the flashback feature on a MySQL server. However, MySQL GTID implementation is different than MariaDB thus restoring the SQL file requires you to disable MySQL GTID.

A couple of advantages using flashback is you do not need to stop the MySQL/MariaDB server to carry out this operation. When the amount of data to revert is small, the flashback process is much faster than recovering the data from a full backup. 

Log All Database Queries

General log basically captures every SQL statement being executed by the client in the MySQL server. However, this might not be a popular decision on a busy production server due to the performance impact and space consumption. If performance matters, binary log has the higher priority to be enabled. General log can be enabled during runtime by running the following commands:

mysql> SET global general_log_file='/tmp/mysql.log'; 
mysql> SET global log_output = 'file';
mysql> SET global general_log = ON;

You can also set the general log output to a table:

mysql> SET global log_output = 'table';

You can then use the standard SELECT statement against the mysql.general_log table to retrieve queries. Do expect a bit more performance impact when running with this configuration as shown in this blog post.

Otherwise, you can use external monitoring tools that can perform query sampling and monitoring so you can filter and audit the queries that come into the server. ClusterControl can be used to collect and summaries all your queries, as shown in the following screenshots where we filter all queries that contain DELETE string:

Similar information is also available under ProxySQL's top queries page (if your application is connecting via ProxySQL):

This can be used to track recent changes that have happened to the database server and can also be used for auditing purposes. 

Conclusion

Your MySQL and MariaDB servers must be well-protected at all times since it usually contains sensitive data that attackers are looking after. You may also use ClusterControl to manage the security aspects of your database servers, as showcased by this blog post, How to Secure Your Open Source Databases with ClusterControl.

Using MariaDB Flashback on a MySQL Server

$
0
0

MariaDB has introduced a very cool feature called Flashback. Flashback is a feature that will allow instances, databases or tables to be rolled back to an old snapshot. Traditionally, to perform a point-in-time recovery (PITR), one would restore a database from a backup, and replay the binary logs to roll forward the database state at a certain time or position. 

With Flashback, the database can be rolled back to a point of time in the past, which is way faster if we just want to see the past that just happened not a long time ago. Occasionally, using flashback might be inefficient if you want to see a very old snapshot of your data relative to the current date and time. Restoring from a delayed slave, or from a backup plus replaying the binary log might be the better options. 

This feature is only available in the MariaDB client package, but that doesn't mean we can not use it with our MySQL servers. This blog post showcases how we can use this amazing feature on a MySQL server.

MariaDB Flashback Requirements

For those who want to use MariaDB flashback feature on top of MySQL, we can basically do the following:

  1. Enable binary log with the following setting:
    1. binlog_format = ROW (default since MySQL 5.7.7).
    2. binlog_row_image = FULL (default since MySQL 5.6).
  2. Use msqlbinlog utility from any MariaDB 10.2.4 and later installation.
  3. Flashback is currently supported only over DML statements (INSERT, DELETE, UPDATE). An upcoming version of MariaDB will add support for flashback over DDL statements (DROP, TRUNCATE, ALTER, etc.) by copying or moving the current table to a reserved and hidden database, and then copying or moving back when using flashback.

The flashback is achieved by taking advantage of existing support for full image format binary logs, thus it supports all storage engines. Note that the flashback events will be stored in memory. Therefore, you should make sure your server has enough memory for this feature.

How Does MariaDB Flashback Work?

MariaDB's mysqlbinlog utility comes with two extra options for this purpose:

  • -B, --flashback - Flashback feature can rollback your committed data to a special time point.
  • -T, --table=[name] - List entries for just this table (local log only).

By comparing the mysqlbinlog output with and without the --flashback flag, we can easily understand how it works. Consider the following statement is executed on a MariaDB server:

MariaDB> DELETE FROM sbtest.sbtest1 WHERE id = 1;

Without flashback flag, we will see the actual DELETE binlog event:

$ mysqlbinlog -vv \
--start-datetime="$(date '+%F %T' -d 'now - 10 minutes')" \
--database=sbtest \
--table=sbtest1 \
/var/lib/mysql/binlog.000003

...
# at 453196541
#200227 12:58:18 server id 37001  end_log_pos 453196766 CRC32 0xdaa248ed Delete_rows: table id 238 flags: STMT_END_F

BINLOG '
6rxXXhOJkAAAQwAAAP06AxsAAO4AAAAAAAEABnNidGVzdAAHc2J0ZXN0MQAEAwP+/gTu4P7wAAEB
AAID/P8AFuAQfA==
6rxXXiCJkAAA4QAAAN47AxsAAO4AAAAAAAEAAgAE/wABAAAAVJ4HAHcAODM4Njg2NDE5MTItMjg3
NzM5NzI4MzctNjA3MzYxMjA0ODYtNzUxNjI2NTk5MDYtMjc1NjM1MjY0OTQtMjAzODE4ODc0MDQt
NDE1NzY0MjIyNDEtOTM0MjY3OTM5NjQtNTY0MDUwNjUxMDItMzM1MTg0MzIzMzA7Njc4NDc5Njcz
NzctNDgwMDA5NjMzMjItNjI2MDQ3ODUzMDEtOTE0MTU0OTE4OTgtOTY5MjY1MjAyOTHtSKLa
'/*!*/;

### DELETE FROM `sbtest`.`sbtest1`
### WHERE
###   @1=1 /* INT meta=0 nullable=0 is_null=0 */
###   @2=499284 /* INT meta=0 nullable=0 is_null=0 */
###   @3='83868641912-28773972837-60736120486-75162659906-27563526494-20381887404-41576422241-93426793964-56405065102-33518432330' /* STRING(480) meta=61152 nullable=0 is_null=0 */
###   @4='67847967377-48000963322-62604785301-91415491898-96926520291' /* STRING(240) meta=65264 nullable=0 is_null=0 */
...

By extending the above mysqlbinlog command with --flashback, we can see the DELETE event is converted to an INSERT event and similarly to the respective WHERE and SET clauses:

$ mysqlbinlog -vv \
--start-datetime="$(date '+%F %T' -d 'now - 10 minutes')" \
--database=sbtest \
--table=sbtest1 \
/var/lib/mysql/binlog.000003 \
--flashback

...
BINLOG '
6rxXXhOJkAAAQwAAAP06AxsAAO4AAAAAAAEABnNidGVzdAAHc2J0ZXN0MQAEAwP+/gTu4P7wAAEB
AAID/P8AFuAQfA==
6rxXXh6JkAAA4QAAAN47AxsAAO4AAAAAAAEAAgAE/wABAAAAVJ4HAHcAODM4Njg2NDE5MTItMjg3
NzM5NzI4MzctNjA3MzYxMjA0ODYtNzUxNjI2NTk5MDYtMjc1NjM1MjY0OTQtMjAzODE4ODc0MDQt
NDE1NzY0MjIyNDEtOTM0MjY3OTM5NjQtNTY0MDUwNjUxMDItMzM1MTg0MzIzMzA7Njc4NDc5Njcz
NzctNDgwMDA5NjMzMjItNjI2MDQ3ODUzMDEtOTE0MTU0OTE4OTgtOTY5MjY1MjAyOTHtSKLa
'/*!*/;

### INSERT INTO `sbtest`.`sbtest1`
### SET
###   @1=1 /* INT meta=0 nullable=0 is_null=0 */
###   @2=499284 /* INT meta=0 nullable=0 is_null=0 */
###   @3='83868641912-28773972837-60736120486-75162659906-27563526494-20381887404-41576422241-93426793964-56405065102-33518432330' /* STRING(480) meta=61152 nullable=0 is_null=0 */
###   @4='67847967377-48000963322-62604785301-91415491898-96926520291' /* STRING(240) meta=65264 nullable=0 is_null=0 */
...

In row-based replication (binlog_format=ROW), each row change event contains two images, a “before” image (except INSERT) whose columns are matched against when searching for the row to be updated, and an “after” image (except DELETE) containing the changes. With binlog_row_image=FULL, MariaDB logs full rows (that is, all columns) for both the before and after images.

The following example shows binary log events for UPDATE. Consider the following statement is executed on a MariaDB server:

MariaDB> UPDATE sbtest.sbtest1 SET k = 0 WHERE id = 5;

When looking at the binlog event for the above statement, we will see something like this:

$ mysqlbinlog -vv \
--start-datetime="$(date '+%F %T' -d 'now - 5 minutes')" \
--database=sbtest \
--table=sbtest1 \
/var/lib/mysql/binlog.000001 

...
### UPDATE `sbtest`.`sbtest1`
### WHERE
###   @1=5 /* INT meta=0 nullable=0 is_null=0 */
###   @2=499813 /* INT meta=0 nullable=0 is_null=0 */
###   @3='44257470806-17967007152-32809666989-26174672567-29883439075-95767161284-94957565003-35708767253-53935174705-16168070783' /* STRING(480) meta=61152 nullable=0 is_null=0 */
###   @4='34551750492-67990399350-81179284955-79299808058-21257255869' /* STRING(240) meta=65264 nullable=0 is_null=0 */
### SET
###   @1=5 /* INT meta=0 nullable=0 is_null=0 */
###   @2=0 /* INT meta=0 nullable=0 is_null=0 */
###   @3='44257470806-17967007152-32809666989-26174672567-29883439075-95767161284-94957565003-35708767253-53935174705-16168070783' /* STRING(480) meta=61152 nullable=0 is_null=0 */
###   @4='34551750492-67990399350-81179284955-79299808058-21257255869' /* STRING(240) meta=65264 nullable=0 is_null=0 */
# Number of rows: 1
...

With the --flashback flag, the "before" image is swapped with the "after" image of the existing row:

$ mysqlbinlog -vv \
--start-datetime="$(date '+%F %T' -d 'now - 5 minutes')" \
--database=sbtest \
--table=sbtest1 \
/var/lib/mysql/binlog.000001 \
 --flashback

...
### UPDATE `sbtest`.`sbtest1`
### WHERE
###   @1=5 /* INT meta=0 nullable=0 is_null=0 */
###   @2=0 /* INT meta=0 nullable=0 is_null=0 */
###   @3='44257470806-17967007152-32809666989-26174672567-29883439075-95767161284-94957565003-35708767253-53935174705-16168070783' /* STRING(480) meta=61152 nullable=0 is_null=0 */
###   @4='34551750492-67990399350-81179284955-79299808058-21257255869' /* STRING(240) meta=65264 nullable=0 is_null=0 */
### SET
###   @1=5 /* INT meta=0 nullable=0 is_null=0 */
###   @2=499813 /* INT meta=0 nullable=0 is_null=0 */
###   @3='44257470806-17967007152-32809666989-26174672567-29883439075-95767161284-94957565003-35708767253-53935174705-16168070783' /* STRING(480) meta=61152 nullable=0 is_null=0 */
###   @4='34551750492-67990399350-81179284955-79299808058-21257255869' /* STRING(240) meta=65264 nullable=0 is_null=0 */
...

We can then redirect the flashback output to the MySQL client, thus rolling back the database or table to the point of time that we want. More examples are shown in the next sections.

MariaDB has a dedicated knowledge base page for this feature. Check out MariaDB Flashback knowledge base page.

MariaDB Flashback With MySQL

To have the flashback ability for MySQL, one has to do the following:

  • Copy the mysqlbinlog utility from any MariaDB server (10.2.4 or later).
  • Disable MySQL GTID before applying the flashback SQL file. Global variables gtid_mode and enforce_gtid_consistency can be set in runtime since MySQL 5.7.5.

Suppose we are having the following simple MySQL 8.0 replication topology:

In this example, we copied mysqlbinlog utility from the latest MariaDB 10.4 on one of our MySQL 8.0 slave (slave2):

(mariadb-server)$ scp /bin/mysqlbinlog root@slave2-mysql:/root/
(slave2-mysql8)$ ls -l /root/mysqlbinlog
-rwxr-xr-x. 1 root root 4259504 Feb 27 13:44 /root/mysqlbinlog

Our MariaDB's mysqlbinlog utility is now located at /root/mysqlbinlog on slave2. On the MySQL master, we executed the following disastrous statement:

mysql> DELETE FROM sbtest1 WHERE id BETWEEN 5 AND 100;
Query OK, 96 rows affected (0.01 sec)

96 rows were deleted in the above statement. Wait a couple of seconds to let the events replicate from master to all slaves before we can try to find the binlog position of the disastrous event on the slave server. The first step is to retrieve all the binary logs on that server:

mysql> SHOW BINARY LOGS;
+---------------+-----------+-----------+
| Log_name      | File_size | Encrypted |
+---------------+-----------+-----------+
| binlog.000001 |       850 |        No |
| binlog.000002 |     18796 |        No |
+---------------+-----------+-----------+

Our disastrous event should exist inside binlog.000002, the latest binary log in this server. We can then use the MariaDB's mysqlbinlog utility to retrieve all binlog events for table sbtest1 since 10 minutes ago:

(slave2-mysql8)$ /root/mysqlbinlog -vv \
--start-datetime="$(date '+%F %T' -d 'now - 10 minutes')" \
--database=sbtest \
--table=sbtest1 \
/var/lib/mysql/binlog.000002

...
# at 195
#200228 15:09:45 server id 37001  end_log_pos 281 CRC32 0x99547474 Ignorable
# Ignorable event type 33 (MySQL Gtid)
# at 281
#200228 15:09:45 server id 37001  end_log_pos 353 CRC32 0x8b12bd3c Query thread_id=19 exec_time=0 error_code=0
SET TIMESTAMP=1582902585/*!*/;
SET @@session.pseudo_thread_id=19/*!*/;
SET @@session.foreign_key_checks=1, @@session.sql_auto_is_null=0, @@session.unique_checks=1, @@session.autocommit=1, @@session.check_constraint_checks=1/*!*/;
SET @@session.sql_mode=524288/*!*/;
SET @@session.auto_increment_increment=1, @@session.auto_increment_offset=1/*!*/;
SET @@session.character_set_client=255,@@session.collation_connection=255,@@session.collation_server=255/*!*/;
SET @@session.lc_time_names=0/*!*/;
SET @@session.collation_database=DEFAULT/*!*/;

BEGIN
/*!*/;
# at 353
#200228 15:09:45 server id 37001  end_log_pos 420 CRC32 0xe0e44a1b Table_map: `sbtest`.`sbtest1` mapped to number 92

# at 420
# at 8625
# at 16830
#200228 15:09:45 server id 37001  end_log_pos 8625 CRC32 0x99b1a8fc Delete_rows: table id 92
#200228 15:09:45 server id 37001  end_log_pos 16830 CRC32 0x89496a07 Delete_rows: table id 92
#200228 15:09:45 server id 37001  end_log_pos 18765 CRC32 0x302413b2 Delete_rows: table id 92 flags: STMT_END_F

To easily look up for the binlog position number, pay attention on the lines that start with "# at ". From the above lines, we can see the DELETE event was happening at position 281 inside binlog.000002 (starts at "# at 281"). We can also retrieve the binlog events directly inside a MySQL server:

mysql> SHOW BINLOG EVENTS IN 'binlog.000002';
+---------------+-------+----------------+-----------+-------------+-------------------------------------------------------------------+
| Log_name      | Pos   | Event_type     | Server_id | End_log_pos | Info                                                              |
+---------------+-------+----------------+-----------+-------------+-------------------------------------------------------------------+
| binlog.000002 |     4 | Format_desc    |     37003 | 124         | Server ver: 8.0.19, Binlog ver: 4                                 |
| binlog.000002 |   124 | Previous_gtids |     37003 | 195         | 0d98d975-59f8-11ea-bd30-525400261060:1                            |
| binlog.000002 |   195 | Gtid           |     37001 | 281         | SET @@SESSION.GTID_NEXT= '0d98d975-59f8-11ea-bd30-525400261060:2' |
| binlog.000002 |   281 | Query          |     37001 | 353         | BEGIN                                                             |
| binlog.000002 |   353 | Table_map      |     37001 | 420         | table_id: 92 (sbtest.sbtest1)                                     |
| binlog.000002 |   420 | Delete_rows    |     37001 | 8625        | table_id: 92                                                      |
| binlog.000002 |  8625 | Delete_rows    |     37001 | 16830       | table_id: 92                                                      |
| binlog.000002 | 16830 | Delete_rows    |     37001 | 18765       | table_id: 92 flags: STMT_END_F                                    |
| binlog.000002 | 18765 | Xid            |     37001 | 18796       | COMMIT /* xid=171006 */                                           |
+---------------+-------+----------------+-----------+-------------+-------------------------------------------------------------------+

9 rows in set (0.00 sec)

We can now confirm that position 281 is where we want our data to revert to. We can then use the --start-position flag to generate accurate flashback events. Notice that we omit the "-vv" flag and add the --flashback flag:

(slave2-mysql8)$ /root/mysqlbinlog \
--start-position=281 \
--database=sbtest \
--table=sbtest1 \
/var/lib/mysql/binlog.000002 \
--flashback > /root/flashback.binlog

The flashback.binlog contains all the required events to undo all changes happened on table sbtest1 on this MySQL server. Since this is a slave node of a replication cluster, we have to break the replication on the chosen slave (slave2) in order to use it for flashback purposes. To do this, we have to stop the replication on the chosen slave, set MySQL GTID to ON_PERMISSIVE and make the slave writable:

mysql> STOP SLAVE; 
SET GLOBAL gtid_mode = ON_PERMISSIVE; 
SET GLOBAL enforce_gtid_consistency = OFF; 
SET GLOBAL read_only = OFF;

At this point, slave2 is not part of the replication and our topology is looking like this:

Import the flashback via mysql client and we do not want this change to be recorded in MySQL binary log:

(slave2-mysql8)$ mysql -uroot -p --init-command='SET sql_log_bin=0' sbtest < /root/flashback.binlog

We can then see all the deleted rows, as proven by the following statement:

mysql> SELECT COUNT(id) FROM sbtest1 WHERE id BETWEEN 5 and 100;
+-----------+
| COUNT(id) |
+-----------+
|        96 |
+-----------+
1 row in set (0.00 sec)

We can then create an SQL dump file for table sbtest1 for our reference:

(slave2-mysql8)$ mysqldump -uroot -p --single-transaction sbtest sbtest1 > sbtest1_flashbacked.sql

Once the flashback operation completes, we can rejoin the slave node back into the replication chain. But firstly, we have to bring back the database into a consistent state, by replaying all events starting from the position we had flashbacked. Don't forget to skip binary logging as we do not want to "write" onto the slave and risking ourselves with errant transactions:

(slave2-mysql8)$ /root/mysqlbinlog \
--start-position=281 \
--database=sbtest \
--table=sbtest1 \
/var/lib/mysql/binlog.000002 | mysql -uroot -p --init-command='SET sql_log_bin=0' sbtest

Finally, prepare the node back to its role as MySQL slave and start the replication:

mysql> SET GLOBAL read_only = ON;
SET GLOBAL enforce_gtid_consistency = ON; 
SET GLOBAL gtid_mode = ON; 
START SLAVE; 

Verify that the slave node is replicating correctly:

mysql> SHOW SLAVE STATUS\G
...
             Slave_IO_Running: Yes
            Slave_SQL_Running: Yes
...

At this point, we have re-joined the slave back into the replication chain and our topology is now back to its original state:

Shout out to the MariaDB team for introducing this astounding feature!

Setting Up a Geo-Distributed Database Cluster Using MySQL Replication

$
0
0

A single point of failure (SPOF)  is a common reason why organizations are working towards distributing the presence of their database environments to another location geographically. It's part of the Disaster Recovery and Business Continuity strategic plans. 

Disaster Recovery (DR) planning embodies technical procedures which cover the preparation for unanticipated issues such as natural disasters, accidents (such as human error), or incidents (such as criminal acts). 

For the past decade, distributing your database environment across multiple geographical locations has been a pretty common setup, as public clouds offer a lot of ways to deal with this. The challenge comes in setting up database environments. It creates challenges when you try to manage the database(s), move your data to another geo-location, or apply security with a high level of observability.

In this blog, we'll showcase how you can do this using MySQL Replication. We'll cover how you are able to copy your data to another database node located in a different country distant from the current geography of the MySQL cluster. For this example, our target region is based on us-east, while my on-prem is in Asia located in the Philippines.

Why Do I Need A Geo-Location Database Cluster?

Even Amazon AWS, the top public cloud provider, claims they suffer from downtime or unintended outages (like the one that happened in 2017). Let's say you are using AWS as your secondary datacenter aside from your on-prem. You cannot have any internal access to its underlying hardware or to those internal networks that are managing your compute nodes. These are fully managed services which you paid for, but you cannot avoid the fact that it can suffer from an outage anytime. If such a geographic location suffers an outage then you can have a long downtime. 

This type of problem must be foreseen during your business continuity planning. It must have been analyzed and implemented based on what has been defined. Business continuity for your MySQL databases should include high uptime. Some environments are doing benchmarks and set a high bar of rigorous tests including the weak side in order to expose any vulnerability, how resilient it can be, and how scalable your technology architecture including your database infrastructure. For business especially those handling high transactions, it is imperative to ensure that production databases are available for the applications all the time even when catastrophe occurs. Otherwise, downtime can be experienced and it might cost you a large amount of money.

With these identified scenarios, organizations start extending their infrastructure to different cloud  providers and putting nodes to different geo-location to have more high uptime (if possible at 99.99999999999), lower RPO, and has no SPOF.

To ensure production databases survive a disaster, a Disaster Recovery (DR) site must be configured. Production and DR sites must be part of two geographically distant datacenters. This means, a standby database must be configured at the DR site for every production database so that, the data changes occurring on production database are immediately synced across to the standby database via transaction logs. Some setups also use their DR nodes to handle reads so as to provide load balancing between application and the data layer.

The Desired Architectural Setup

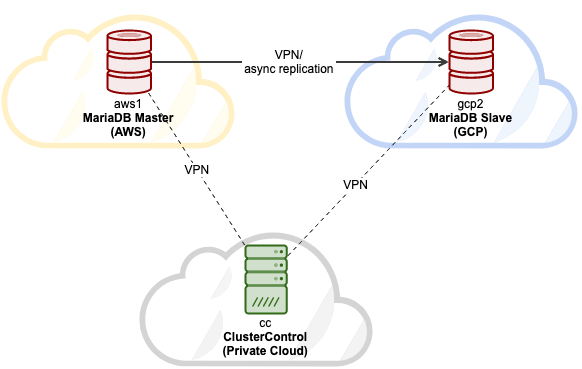
In this blog, the desired setup is simple and yet very common implementation nowadays. See below on the desired architectural setup for this blog:

In this blog, I choose Google Cloud Platform (GCP) as the public cloud provider, and using my local network as my on-prem database environment.

It is a must that when using this type of design, you always need both environment or platform to communicate in a very secure manner. Using VPN or using alternatives such as AWS Direct Connect. Although these public clouds nowadays offer managed VPN services which you can use. But for this setup, we'll be using OpenVPN since I don't need sophisticated hardware or service for this blog.

Best and Most Efficient Way

For MySQL/Percona/MariaDB database environments, the best and efficient way is to take a backup copy of your database, send to the target node to be deployed or instantiated. There are different ways to use this approach either you can use mysqldump, mydumper, rsync, or use Percona XtraBackup/Mariabackup and stream the data going to your target node.

Using mysqldump

mysqldump creates a logical backup of your whole database or you can selectively choose a list of databases, tables, or even specific records that you wanted to dump. 

A simple command that you can use to take a full backup can be,

$ mysqldump --single-transaction --all-databases --triggers --routines --events --master-data | mysql -h <target-host-db-node -u<user> -p<password> -vvv --show-warnings

With this simple command, it will directly run the MySQL statements to the target database node, for example your target database node on a Google Compute Engine. This can be efficient when data is smaller or you have a fast bandwidth. Otherwise, packing your database to a file then send it to the target node can be your option.

$ mysqldump --single-transaction --all-databases --triggers --routines --events --master-data | gzip > mydata.db

$ scp mydata.db <target-host>:/some/path

Then run mysqldump to the target database node as such,

zcat mydata.db | mysql

The downside with using logical backup using mysqldump is it's slower and consumes disk space. It also uses a single thread so you cannot run this in parallel. Optionally, you can use mydumper especially when your data is too huge. mydumper can be run in parallel but it's not as flexible compared to mysqldump.

Using xtrabackup

xtrabackup is a physical backup where you can send the streams or binary to the target node. This is very efficient and is mostly used when streaming a backup over the network especially when the target node is of different geography or different region. ClusterControl uses xtrabackup when provisioning or instantiating a new slave regardless where it is located as long as access and permission has been setup prior to the action.

If you are using xtrabackup to run it manually, you can run the command as such,

## Target node

$  socat -u tcp-listen:9999,reuseaddr stdout 2>/tmp/netcat.log | xbstream -x -C /var/lib/mysql

## Source node

$ innobackupex --defaults-file=/etc/my.cnf --stream=xbstream --socket=/var/lib/mysql/mysql.sock  --host=localhost --tmpdir=/tmp /tmp | socat -u stdio TCP:192.168.10.70:9999

To elaborate those two commands,the first command has to be executed or run first on the target node. The target node command does listen on port 9999 and will write any stream that is received from port 9999 in the target node. It is dependent on commands socat and xbstream which means you must ensure you have these packages installed.

On the source node, it executes the innobackupex perl script which invokes xtrabackup in the background and uses xbstream to stream the data that will be sent over the network. The socat command opens the port 9999 and sends its data to the desired host, which is 192.168.10.70 in this example. Still, ensure that you have socat and xbstream installed when using this command. Alternative way of using socat is nc but socat offers more advanced features compared to nc such as serialization like multiple clients can listen on a port. 

ClusterControl uses this command when rebuilding a slave or building a new slave.  It is fast and guarantees the exact copy of your source data will be copied to your target node. When provisioning a new database into a separate geo-location, using this approach offers more efficiency and offers you more speed to finish the job. Although there can be pros and cons when using logical or binary backup when streamed through the wire. Using this method is a very common approach when setting up a new geo-location database cluster to a different region and create an exact copy of your database environment.

Efficiency, Observability, and Speed

Questions left by most people who are not familiar with this approach always covers the "HOW, WHAT, WHERE" problems. In this section, we'll cover how you can efficiently setup your geo-location database with less work to deal with and with observability why it fails. Using ClusterControl is very efficient. In this current setup I have, the following environment as initially implemented:

Extending Node to GCP

Starting to setup your geo-Location database cluster, to extend your cluster and create a snapshot copy of your cluster, you can add a new slave. As mentioned earlier, ClusterControl will use xtrabackup (mariabackup for MariaDB 10.2 onwards) and deploy a new node within your cluster. Before you can register your GCP compute nodes as your target nodes, you need to setup first the appropriate system user the same as the system user you registered in ClusterControl. You can verify this in your /etc/cmon.d/cmon_X.cnf, where X is the cluster_id. For example, see below:

# grep 'ssh_user' /etc/cmon.d/cmon_27.cnf 

ssh_user=maximus

maximus(in this example) must be present in your GCP compute nodes. The user in your GCP nodes must have the sudo or super admin privileges. It must also be setup with a password-less SSH access. Please read our documentation more about the system user and it's required privileges.

Let's have an example list of servers below (from GCP console: Compute Engine dashboard):

In the screenshot above, our target region is based on the us-east region. As noted earlier, my local network is setup over a secure layer going through GCP (vice-versa) using OpenVPN. So communication from GCP going to my local network is also encapsulated over the VPN tunnel.

Add a Slave Node To GCP

The screenshot below reveals how you can do this. See images below:

As seen in the second screenshot, we're targeting node 10.142.0.12 and its source master is 192.168.70.10. ClusterControl is smart enough to determine firewalls, security modules, packages, configuration, and setup that needs to be done. See below an example of job activity log:

Quite a simple task, isn't it?

Complete The GCP MySQL Cluster

We need to add two nodes more to the GCP cluster to have a balance topology as we did have in the local network. For the second and third node, ensure that the master must be pointing to your GCP node. In this example, the master is 10.142.0.12. See below how to do this,

As seen in the screenshot above, I selected the 10.142.0.12 (slave) which is the first node we have added into the cluster. The complete result shows as follows,

Your Final Setup of Geo-Location Database Cluster

From the last screenshot, this kind of topology might not be your ideal setup. Mostly, it has to be a multi-master setup, where your DR cluster serves as the standby cluster, where as your on-prem serves as the primary active cluster. To do this, it's quite simple in ClusterControl. See the following screenshots to achieve this goal.

You can just drag your current master to the target master that has to be setup as a primary-standby writer just in case your on-prem in harm. In this example, we drag targeting host 10.142.0.12 (GCP compute node). The end result is shown below:

Then it achieves the desired result. Easy, and very quick to spawn your Geo-Location Database cluster using MySQL Replication.

Conclusion

Having a Geo-Location Database Cluster is not new. It has been a desired setup for companies and organizations avoiding SPOF who want resilience and a lower RPO. 

The main takeaways for this setup are security, redundancy, and resilience. It also covers how feasible and efficient you can deploy your new cluster to a different geographic region. While ClusterControl can offer this, expect we can have more improvement on this sooner where you can create efficiently from a backup and spawn your new different cluster in ClusterControl, so stay tuned.

How to Fix a Lock Wait Timeout Exceeded Error in MySQL

$
0
0

One of the most popular InnoDB's errors is InnoDB lock wait timeout exceeded, for example:

SQLSTATE[HY000]: General error: 1205 Lock wait timeout exceeded; try restarting transaction

The above simply means the transaction has reached the innodb_lock_wait_timeout while waiting to obtain an exclusive lock which defaults to 50 seconds. The common causes are:

  1. The offensive transaction is not fast enough to commit or rollback the transaction within innodb_lock_wait_timeout duration.
  2. The offensive transaction is waiting for row lock to be released by another transaction.

The Effects of a InnoDB Lock Wait Timeout

InnoDB lock wait timeout can cause two major implications:

  • The failed statement is not being rolled back by default.
  • Even if innodb_rollback_on_timeout is enabled, when a statement fails in a transaction, ROLLBACK is still a more expensive operation than COMMIT.

Let's play around with a simple example to better understand the effect. Consider the following two tables in database mydb:

mysql> CREATE SCHEMA mydb;
mysql> USE mydb;

The first table (table1):

mysql> CREATE TABLE table1 ( id INT PRIMARY KEY AUTO_INCREMENT, data VARCHAR(50));
mysql> INSERT INTO table1 SET data = 'data #1';

The second table (table2):

mysql> CREATE TABLE table2 LIKE table1;
mysql> INSERT INTO table2 SET data = 'data #2';

We executed our transactions in two different sessions in the following order:

Ordering

Transaction #1 (T1)

Transaction #2 (T2)

1

SELECT * FROM table1;

(OK)

SELECT * FROM table1;

(OK)

2

UPDATE table1 SET data = 'T1 is updating the row' WHERE id = 1;  

(OK)


3


UPDATE table2 SET data = 'T2 is updating the row' WHERE id = 1; 

(OK)

4


UPDATE table1 SET data = 'T2 is updating the row' WHERE id = 1; 

(Hangs for a while and eventually returns an error "Lock wait timeout exceeded; try restarting transaction")

5

COMMIT;

(OK)


6


COMMIT;

(OK)

However, the end result after step #6 might be surprising if we did not retry the timed out statement at step #4:
mysql> SELECT * FROM table1 WHERE id = 1;
+----+-----------------------------------+
| id | data                              |
+----+-----------------------------------+
| 1  | T1 is updating the row            |
+----+-----------------------------------+


mysql> SELECT * FROM table2 WHERE id = 1;
+----+-----------------------------------+
| id | data                              |
+----+-----------------------------------+
| 1  | T2 is updating the row            |
+----+-----------------------------------+

After T2 was successfully committed, one would expect to get the same output "T2 is updating the row" for both table1 and table2 but the results show that only table2 was updated. One might think that if any error encounters within a transaction, all statements in the transaction would automatically get rolled back, or if a transaction is successfully committed, the whole statements were executed atomically. This is true for deadlock, but not for InnoDB lock wait timeout.

Unless you set innodb_rollback_on_timeout=1 (default is 0 - disabled), automatic rollback is not going to happen for InnoDB lock wait timeout error. This means, by following the default setting, MySQL is not going to fail and rollback the whole transaction, nor retrying again the timed out statement and just process the next statements until it reaches COMMIT or ROLLBACK. This explains why transaction T2 was partially committed!

The InnoDB documentation clearly says "InnoDB rolls back only the last statement on a transaction timeout by default". In this case, we do not get the transaction atomicity offered by InnoDB. The atomicity in ACID compliant is either we get all or nothing of the transaction, which means partial transaction is merely unacceptable.

Dealing With a InnoDB Lock Wait Timeout

So, if you are expecting a transaction to auto-rollback when encounters an InnoDB lock wait error, similarly as what would happen in deadlock, set the following option in MySQL configuration file:

innodb_rollback_on_timeout=1

A MySQL restart is required. When deploying a MySQL-based cluster, ClusterControl will always set innodb_rollback_on_timeout=1 on every node. Without this option, your application has to retry the failed statement, or perform ROLLBACK explicitly to maintain the transaction atomicity.

To verify if the configuration is loaded correctly:

mysql> SHOW GLOBAL VARIABLES LIKE 'innodb_rollback_on_timeout';
+----------------------------+-------+
| Variable_name              | Value |
+----------------------------+-------+
| innodb_rollback_on_timeout | ON    |
+----------------------------+-------+

To check whether the new configuration works, we can track the com_rollback counter when this error happens:

mysql> SHOW GLOBAL STATUS LIKE 'com_rollback';
+---------------+-------+
| Variable_name | Value |
+---------------+-------+
| Com_rollback  | 1     |
+---------------+-------+

Tracking the Blocking Transaction

There are several places that we can look to track the blocking transaction or statements. Let's start by looking into InnoDB engine status under TRANSACTIONS section:

mysql> SHOW ENGINE INNODB STATUS\G
------------
TRANSACTIONS
------------

...

---TRANSACTION 3100, ACTIVE 2 sec starting index read
mysql tables in use 1, locked 1
LOCK WAIT 2 lock struct(s), heap size 1136, 1 row lock(s)
MySQL thread id 50, OS thread handle 139887555282688, query id 360 localhost ::1 root updating
update table1 set data = 'T2 is updating the row' where id = 1

------- TRX HAS BEEN WAITING 2 SEC FOR THIS LOCK TO BE GRANTED:
RECORD LOCKS space id 6 page no 4 n bits 72 index PRIMARY of table `mydb`.`table1` trx id 3100 lock_mode X locks rec but not gap waiting
Record lock, heap no 2 PHYSICAL RECORD: n_fields 4; compact format; info bits 0
 0: len 4; hex 80000001; asc     ;;
 1: len 6; hex 000000000c19; asc       ;;
 2: len 7; hex 020000011b0151; asc       Q;;
 3: len 22; hex 5431206973207570646174696e672074686520726f77; asc T1 is updating the row;;
------------------

---TRANSACTION 3097, ACTIVE 46 sec
2 lock struct(s), heap size 1136, 1 row lock(s), undo log entries 1
MySQL thread id 48, OS thread handle 139887556167424, query id 358 localhost ::1 root
Trx read view will not see trx with id >= 3097, sees < 3097

From the above information, we can get an overview of the transactions that are currently active in the server. Transaction 3097 is currently locking a row that needs to be accessed by transaction 3100. However, the above output does not tell us the actual query text that could help us figuring out which part of the query/statement/transaction that we need to investigate further. By using the blocker MySQL thread ID 48, let's see what we can gather from MySQL processlist:

mysql> SHOW FULL PROCESSLIST;
+----+-----------------+-----------------+--------------------+---------+------+------------------------+-----------------------+
| Id | User            | Host            | db                 | Command | Time | State                  | Info                  |
+----+-----------------+-----------------+--------------------+---------+------+------------------------+-----------------------+
| 4  | event_scheduler | localhost       | <null>             | Daemon  | 5146 | Waiting on empty queue | <null>                |
| 10 | root            | localhost:56042 | performance_schema | Query   | 0    | starting               | show full processlist |
| 48 | root            | localhost:56118 | mydb               | Sleep   | 145  |                        | <null>                |
| 50 | root            | localhost:56122 | mydb               | Sleep   | 113  |                        | <null>                |
+----+-----------------+-----------------+--------------------+---------+------+------------------------+-----------------------+

Thread ID 48 shows the command as 'Sleep'. Still, this does not help us much to know which statements that block the other transaction. This is because the statement in this transaction has been executed and this open transaction is basically doing nothing at the moment. We need to dive further down to see what is going on with this thread.

For MySQL 8.0, the InnoDB lock wait instrumentation is available under data_lock_waits table inside performance_schema database (or innodb_lock_waits table inside sys database). If a lock wait event is happening, we should see something like this:

mysql> SELECT * FROM performance_schema.data_lock_waits\G
***************************[ 1. row ]***************************
ENGINE                           | INNODB
REQUESTING_ENGINE_LOCK_ID        | 139887595270456:6:4:2:139887487554680
REQUESTING_ENGINE_TRANSACTION_ID | 3100
REQUESTING_THREAD_ID             | 89
REQUESTING_EVENT_ID              | 8
REQUESTING_OBJECT_INSTANCE_BEGIN | 139887487554680
BLOCKING_ENGINE_LOCK_ID          | 139887595269584:6:4:2:139887487548648
BLOCKING_ENGINE_TRANSACTION_ID   | 3097
BLOCKING_THREAD_ID               | 87
BLOCKING_EVENT_ID                | 9
BLOCKING_OBJECT_INSTANCE_BEGIN   | 139887487548648

Note that in MySQL 5.6 and 5.7, the similar information is stored inside innodb_lock_waits table under information_schema database. Pay attention to the BLOCKING_THREAD_ID value. We can use the this information to look for all statements being executed by this thread in events_statements_history table:

mysql> SELECT * FROM performance_schema.events_statements_history WHERE `THREAD_ID` = 87;
0 rows in set

It looks like the thread information is no longer there. We can verify by checking the minimum and maximum value of the thread_id column in events_statements_history table with the following query:

mysql> SELECT min(`THREAD_ID`), max(`THREAD_ID`) FROM performance_schema.events_statements_history;
+------------------+------------------+
| min(`THREAD_ID`) | max(`THREAD_ID`) |
+------------------+------------------+
| 98               | 129              |
+------------------+------------------+

The thread that we were looking for (87) has been truncated from the table. We can confirm this by looking at the size of event_statements_history table:

mysql> SELECT @@performance_schema_events_statements_history_size;
+-----------------------------------------------------+
| @@performance_schema_events_statements_history_size |
+-----------------------------------------------------+
| 10                                                  |
+-----------------------------------------------------+

The above means the events_statements_history can only store the last 10 threads. Fortunately, performance_schema has another table to store more rows called events_statements_history_long, which stores similar information but for all threads and it can contain way more rows:

mysql> SELECT @@performance_schema_events_statements_history_long_size;
+----------------------------------------------------------+
| @@performance_schema_events_statements_history_long_size |
+----------------------------------------------------------+
| 10000                                                    |
+----------------------------------------------------------+

However, you will get an empty result if you try to query the events_statements_history_long table for the first time. This is expected because by default, this instrumentation is disabled in MySQL as we can see in the following setup_consumers table:

mysql> SELECT * FROM performance_schema.setup_consumers;
+----------------------------------+---------+
| NAME                             | ENABLED |
+----------------------------------+---------+
| events_stages_current            | NO      |
| events_stages_history            | NO      |
| events_stages_history_long       | NO      |
| events_statements_current        | YES     |
| events_statements_history        | YES     |
| events_statements_history_long   | NO      |
| events_transactions_current      | YES     |
| events_transactions_history      | YES     |
| events_transactions_history_long | NO      |
| events_waits_current             | NO      |
| events_waits_history             | NO      |
| events_waits_history_long        | NO      |
| global_instrumentation           | YES     |
| thread_instrumentation           | YES     |
| statements_digest                | YES     |
+----------------------------------+---------+

To activate table events_statements_history_long, we need to update the setup_consumers table as below:

mysql> UPDATE performance_schema.setup_consumers SET enabled = 'YES' WHERE name = 'events_statements_history_long';

Verify if there are rows in the events_statements_history_long table now:

mysql> SELECT count(`THREAD_ID`) FROM performance_schema.events_statements_history_long;
+--------------------+
| count(`THREAD_ID`) |
+--------------------+
| 4                  |
+--------------------+

Cool. Now we can wait until the InnoDB lock wait event raises again and when it is happening, you should see the following row in the data_lock_waits table:

mysql> SELECT * FROM performance_schema.data_lock_waits\G
***************************[ 1. row ]***************************
ENGINE                           | INNODB
REQUESTING_ENGINE_LOCK_ID        | 139887595270456:6:4:2:139887487555024
REQUESTING_ENGINE_TRANSACTION_ID | 3083
REQUESTING_THREAD_ID             | 60
REQUESTING_EVENT_ID              | 9
REQUESTING_OBJECT_INSTANCE_BEGIN | 139887487555024
BLOCKING_ENGINE_LOCK_ID          | 139887595269584:6:4:2:139887487548648
BLOCKING_ENGINE_TRANSACTION_ID   | 3081
BLOCKING_THREAD_ID               | 57
BLOCKING_EVENT_ID                | 8
BLOCKING_OBJECT_INSTANCE_BEGIN   | 139887487548648

Again, we use the BLOCKING_THREAD_ID value to filter all statements that have been executed by this thread against events_statements_history_long table: 

mysql> SELECT `THREAD_ID`,`EVENT_ID`,`EVENT_NAME`, `CURRENT_SCHEMA`,`SQL_TEXT` FROM events_statements_history_long 
WHERE `THREAD_ID` = 57
ORDER BY `EVENT_ID`;
+-----------+----------+-----------------------+----------------+----------------------------------------------------------------+
| THREAD_ID | EVENT_ID | EVENT_NAME            | CURRENT_SCHEMA | SQL_TEXT                                                       |
+-----------+----------+-----------------------+----------------+----------------------------------------------------------------+
| 57        | 1        | statement/sql/select  | <null>         | select connection_id()                                         |
| 57        | 2        | statement/sql/select  | <null>         | SELECT @@VERSION                                               |
| 57        | 3        | statement/sql/select  | <null>         | SELECT @@VERSION_COMMENT                                       |
| 57        | 4        | statement/com/Init DB | <null>         | <null>                                                         |
| 57        | 5        | statement/sql/begin   | mydb           | begin                                                          |
| 57        | 7        | statement/sql/select  | mydb           | select 'T1 is in the house'                                    |
| 57        | 8        | statement/sql/select  | mydb           | select * from table1                                           |
| 57        | 9        | statement/sql/select  | mydb           | select 'some more select'                                      |
| 57        | 10       | statement/sql/update  | mydb           | update table1 set data = 'T1 is updating the row' where id = 1 |
+-----------+----------+-----------------------+----------------+----------------------------------------------------------------+

Finally, we found the culprit. We can tell by looking at the sequence of events of thread 57 where the above transaction (T1) still has not finished yet (no COMMIT or ROLLBACK), and we can see the very last statement has obtained an exclusive lock to the row for update operation which needed by the other transaction (T2) and just hanging there. That explains why we see 'Sleep' in the MySQL processlist output.

As we can see, the above SELECT statement requires you to get the thread_id value beforehand. To simplify this query, we can use IN clause and a subquery to join both tables. The following query produces an identical result like the above:

mysql> SELECT `THREAD_ID`,`EVENT_ID`,`EVENT_NAME`, `CURRENT_SCHEMA`,`SQL_TEXT` from events_statements_history_long WHERE `THREAD_ID` IN (SELECT `BLOCKING_THREAD_ID` FROM data_lock_waits) ORDER BY `EVENT_ID`;
+-----------+----------+-----------------------+----------------+----------------------------------------------------------------+
| THREAD_ID | EVENT_ID | EVENT_NAME            | CURRENT_SCHEMA | SQL_TEXT                                                       |
+-----------+----------+-----------------------+----------------+----------------------------------------------------------------+
| 57        | 1        | statement/sql/select  | <null>         | select connection_id()                                         |
| 57        | 2        | statement/sql/select  | <null>         | SELECT @@VERSION                                               |
| 57        | 3        | statement/sql/select  | <null>         | SELECT @@VERSION_COMMENT                                       |
| 57        | 4        | statement/com/Init DB | <null>         | <null>                                                         |
| 57        | 5        | statement/sql/begin   | mydb           | begin                                                          |
| 57        | 7        | statement/sql/select  | mydb           | select 'T1 is in the house'                                    |
| 57        | 8        | statement/sql/select  | mydb           | select * from table1                                           |
| 57        | 9        | statement/sql/select  | mydb           | select 'some more select'                                      |
| 57        | 10       | statement/sql/update  | mydb           | update table1 set data = 'T1 is updating the row' where id = 1 |
+-----------+----------+-----------------------+----------------+----------------------------------------------------------------+

However, it is not practical for us to execute the above query whenever InnoDB lock wait event occurs. Apart from the error from the application, how would you know that the lock wait event is happening? We can automate this query execution with the following simple Bash script, called track_lockwait.sh:

$ cat track_lockwait.sh
#!/bin/bash
## track_lockwait.sh
## Print out the blocking statements that causing InnoDB lock wait

INTERVAL=5
DIR=/root/lockwait/

[ -d $dir ] || mkdir -p $dir

while true; do
  check_query=$(mysql -A -Bse 'SELECT THREAD_ID,EVENT_ID,EVENT_NAME,CURRENT_SCHEMA,SQL_TEXT FROM events_statements_history_long WHERE THREAD_ID IN (SELECT BLOCKING_THREAD_ID FROM data_lock_waits) ORDER BY EVENT_ID')

  # if $check_query is not empty
  if [[ ! -z $check_query ]]; then
    timestamp=$(date +%s)
    echo $check_query > $DIR/innodb_lockwait_report_${timestamp}
  fi

  sleep $INTERVAL
done

Apply executable permission and daemonize the script in the background:

$ chmod 755 track_lockwait.sh
$ nohup ./track_lockwait.sh &

Now, we just need to wait for the reports to be generated under the /root/lockwait directory. Depending on the database workload and row access patterns, you might probably see a lot of files under this directory. Monitor the directory closely otherwise it would be flooded with too many report files.

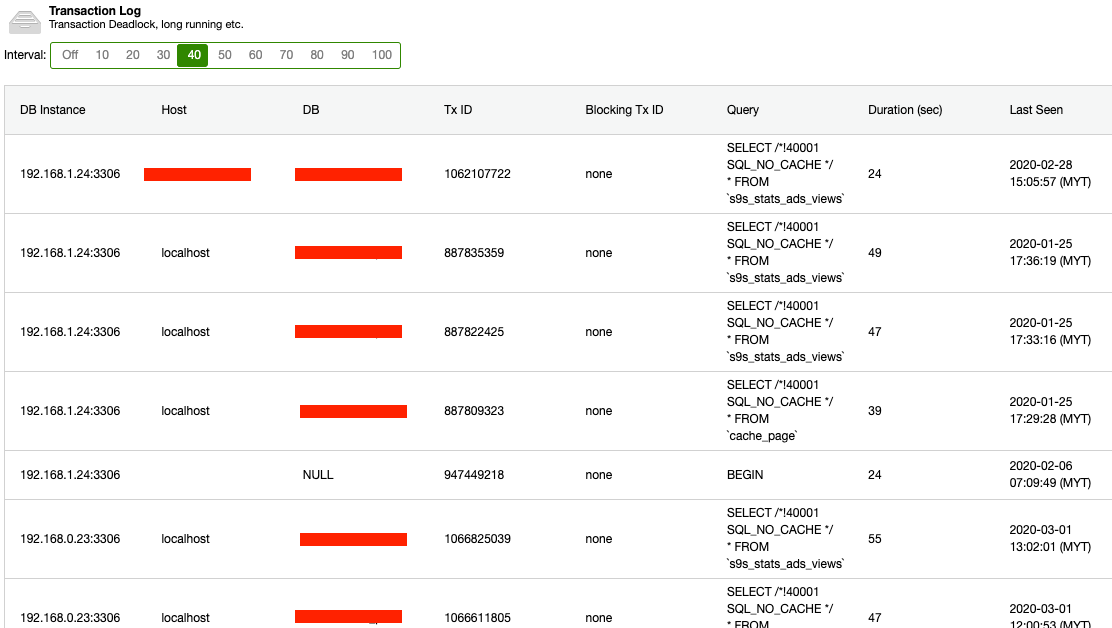
If you are using ClusterControl, you can enable the Transaction Log feature under Performance -> Transaction Log where ClusterControl will provide a report on deadlocks and long-running transactions which will ease up your life in finding the culprit.

Conclusion

It is really important to enable innodb_rollback_on_timeout if your application does not handle the InnoDB lock wait timeout error properly. Otherwise, you might lose the transaction atomicity, and tracking down the culprit is not a straightforward task.

How to Install and Configure MaxScale for MariaDB

$
0
0

There are different reasons for adding a load balancer between your application and your database. If you have high traffic (and you want to balance the traffic between different database nodes) or you want to use the load balancer as a single endpoint (so in case of failover, this load balancer will cope with this issue sending the traffic to the available/healthy node.) It could also be that you want to use different ports to write and read data from your database. 

In all these cases, a load balancer will be useful for you, and if you have a MariaDB cluster, one option for this is using MaxScale which is a database proxy for MariaDB databases.

In this blog, we will show you how to install and configure it manually, and how ClusterControl can help you in this task. For this example, we will use a MariaDB replication cluster with 1 master and 1 slave node, and CentOS8 as the operating system.

How to Install MaxScale

We will assume you have your MariaDB database up and running, and also a machine (virtual or physical) to install MaxScale. We recommend you use a different host, so in case of master failure, MaxScale can failover to the slave node, otherwise, MaxScale can’t take any action if the server where it is running goes down.

There are different ways to install MaxScale, in this case, we will use the MariaDB repositories. To add it into the MaxScale server, you have to run:

$ curl -sS https://downloads.mariadb.com/MariaDB/mariadb_repo_setup | sudo bash

[info] Repository file successfully written to /etc/yum.repos.d/mariadb.repo

[info] Adding trusted package signing keys...

[info] Successfully added trusted package signing keys

Now, install the MaxScale package:

$ yum install maxscale

Now you have your MaxScale node installed, before starting, you need to configure it.

How to Configure MaxScale

As MaxScale perform tasks like authentication, monitoring, and more, you need to create a database user with some specific privileges:

MariaDB [(none)]> CREATE USER 'maxscaleuser'@'%' IDENTIFIED BY 'maxscalepassword';

MariaDB [(none)]> GRANT SELECT ON mysql.user TO 'maxscaleuser'@'%';

MariaDB [(none)]> GRANT SELECT ON mysql.db TO 'maxscaleuser'@'%';

MariaDB [(none)]> GRANT SELECT ON mysql.tables_priv TO 'maxscaleuser'@'%';

MariaDB [(none)]> GRANT SELECT ON mysql.roles_mapping TO 'maxscaleuser'@'%';

MariaDB [(none)]> GRANT SHOW DATABASES ON *.* TO 'maxscaleuser'@'%';

MariaDB [(none)]> GRANT REPLICATION CLIENT on *.* to 'maxscaleuser'@'%';

Keep in mind that MariaDB versions 10.2.2 to 10.2.10 also require:

MariaDB [(none)]> GRANT SELECT ON mysql.* TO 'maxscaleuser'@'%';

Now you have the database user ready, let’s see the configuration files. When you install MaxScale, the file maxscale.cnf will be created under /etc/. There are several variables and different ways to configure it, so let’s see an example:

$ cat  /etc/maxscale.cnf 

# Global parameters

[maxscale]

threads = auto

log_augmentation = 1

ms_timestamp = 1

syslog = 1


# Server definitions

[server1]

type=server

address=192.168.100.126

port=3306

protocol=MariaDBBackend

[server2]

type=server

address=192.168.100.127

port=3306

protocol=MariaDBBackend


# Monitor for the servers

[MariaDB-Monitor]

type=monitor

module=mariadbmon

servers=server1,server2

user=maxscaleuser

password=maxscalepassword

monitor_interval=2000


# Service definitions

[Read-Only-Service]

type=service

router=readconnroute

servers=server2

user=maxscaleuser

password=maxscalepassword

router_options=slave

[Read-Write-Service]

type=service

router=readwritesplit

servers=server1

user=maxscaleuser

password=maxscalepassword


# Listener definitions for the services

[Read-Only-Listener]

type=listener

service=Read-Only-Service

protocol=MariaDBClient

port=4008

[Read-Write-Listener]

type=listener

service=Read-Write-Service

protocol=MariaDBClient

port=4006

In this configuration, we have 2 database nodes, 192.168.100.126 (Master) and 192.168.100.127 (Slave), as you can see in the Servers Definition section.

We have also 2 different services, one for read-only, where there is the slave node, and another one for read-write where there is the master node.

Finally, we have 2 listeners, one for each service. The read-only listener, listening in the port 4008, and the read-write one, listening in the port 4006.

This is a basic configuration file. If you need something more specific you can follow the official MariaDB documentation.

Now you are ready to start it, so just run:

$ systemctl start maxscale.service

And check it:

$ maxctrl list services
ff
$ maxctrl list servers

You can find a maxctrl commands list here, or you can even use maxadmin to manage it.

Now let’s test the connection. For this, you can try to access your database using the MaxScale IP address and the port that you want to test. In our case, the traffic on the port 4006 should be sent to server1, and the traffic on the port 4008 to server2.

$ mysql -h 192.168.100.128 -umaxscaleuser -pmaxscalepassword -P4006 -e 'SELECT @@hostname;'

+------------+

| @@hostname |

+------------+

| server1   |

+------------+

$ mysql -h 192.168.100.128 -umaxscaleuser -pmaxscalepassword -P4008 -e 'SELECT @@hostname;'

+------------+

| @@hostname |

+------------+

| server2   |

+------------+

It works!

How to Deploy MaxScale with ClusterControl

Let’s see now, how you can use ClusterControl to simplify this task. For this, we will assume you have your MariaDB cluster added to ClusterControl.

Go to ClusterControl -> Select the MariaDB cluster -> Cluster Actions -> Add Load Balancer -> MaxScale.

Here you can deploy a new MaxScale node or you can also import an existing one. If you are deploying it, you need to add the IP Address or Hostname, the admin and user MaxScale credentials, amount of threads, and ports (write and read-only). You can also specify which database node you want to add to the MaxScale configuration.

You can monitor the task in the ClusterControl Activity section. When it finishes, you will have a new MaxScale node in your MariaDB cluster.

And running the MaxScale commands from the ClusterControl UI without the need of accessing the server via SSH.

It looks easier than deploying it manually, right?

Conclusion

Having a Load Balancer is a good solution if you want to balance or split your traffic, or even for failover actions, and MaxScale, as a MariaDB product, is a good option for MariaDB databases

The installation is easy, but the configuration and usage could be difficult if it is something new for you. In that case, you can use ClusterControl to deploy, configure, and manage it in an easier way.

How to Replace an Intermediate MySQL or MariaDB Master with a Binlog Server using MaxScale

$
0
0

Binary logs (binlogs) contain records of all changes to the databases. They are necessary for replication and can also be used to restore data after a backup. A binlog server is basically a binary log repository. You can think of it like a server with a dedicated purpose to retrieve binary logs from a master, while slave servers can connect to it like they would connect to a master server.

Some advantages of having a binlog server over intermediate master to distribute replication workload are:

  • You can switch to a new master server without the slaves noticing that the actual master server has changed. This allows for a more highly available replication setup where replication is high-priority.
  • Reduce the load on the master by only serving Maxscale’s binlog server instead of all the slaves.
  • The data in the binary log of the intermediate master is not a direct copy of the data that was received from the binary log of the real master. As such, if group commit is used, this can cause a reduction in the parallelism of the commits and a subsequent reduction in the performance of the slave servers.
  • Intermediate slave has to re-execute every SQL statement which potentially adds latency and lags into the replication chain.

In this blog post, we are going to look into how to replace an intermediate master (a slave host relay to other slaves in a replication chain) with a binlog server running on MaxScale for better scalability and performance.

Architecture

We basically have a 4-node MariaDB v10.4 replication setup with one MaxScale v2.3 sitting on top of the replication to distribute incoming queries. Only one slave is connected to a master (intermediate master) and the other slaves replicate from the intermediate master to serve read workloads, as illustrated in the following diagram.

We are going to turn the above topology into this:

Basically, we are going to remove the intermediate master role and replace it with a binlog server running on MaxScale. The intermediate master will be converted to a standard slave, just like other slave hosts. The binlog service will be listening on port 5306 on the MaxScale host. This is the port that all slaves will be connecting to for replication later on.

Configuring MaxScale as a Binlog Server

In this example, we already have a MaxScale sitting on top of our replication cluster acting as a load balancer for our applications. If you don't have a MaxScale, you can use ClusterControl to deploy simply go to Cluster Actions -> Add Load Balancer -> MaxScale and fill up the necessary information as the following:

Before we get started, let's export the current MaxScale configuration into a text file for backup. MaxScale has a flag called --export-config for this purpose but it must be executed as maxscale user. Thus, the command to export is:

$ su -s /bin/bash -c '/bin/maxscale --export-config=/tmp/maxscale.cnf' maxscale

On the MariaDB master, create a replication slave user called 'maxscale_slave' to be used by the MaxScale and assign it with the following privileges:

$ mysql -uroot -p -h192.168.0.91 -P3306
MariaDB> CREATE USER 'maxscale_slave'@'%' IDENTIFIED BY 'BtF2d2Kc8H';
MariaDB> GRANT SELECT ON mysql.user TO 'maxscale_slave'@'%';
MariaDB> GRANT SELECT ON mysql.db TO 'maxscale_slave'@'%';
MariaDB> GRANT SELECT ON mysql.tables_priv TO 'maxscale_slave'@'%';
MariaDB> GRANT SELECT ON mysql.roles_mapping TO 'maxscale_slave'@'%';
MariaDB> GRANT SHOW DATABASES ON *.* TO 'maxscale_slave'@'%';
MariaDB> GRANT REPLICATION SLAVE ON *.* TO 'maxscale_slave'@'%';

For ClusterControl users, go to Manage -> Schemas and Users to create the necessary privileges.

Before we move further with the configuration, it's important to review the current state and topology of our backend servers:

$ maxctrl list servers
┌────────┬──────────────┬──────┬─────────────┬──────────────────────────────┬───────────┐
│ Server │ Address      │ Port │ Connections │ State                        │ GTID      │
├────────┼──────────────┼──────┼─────────────┼──────────────────────────────┼───────────┤
│ DB_757 │ 192.168.0.90 │ 3306 │ 0           │ Master, Running              │ 0-38001-8 │
├────────┼──────────────┼──────┼─────────────┼──────────────────────────────┼───────────┤
│ DB_758 │ 192.168.0.91 │ 3306 │ 0           │ Relay Master, Slave, Running │ 0-38001-8 │
├────────┼──────────────┼──────┼─────────────┼──────────────────────────────┼───────────┤
│ DB_759 │ 192.168.0.92 │ 3306 │ 0           │ Slave, Running               │ 0-38001-8 │
├────────┼──────────────┼──────┼─────────────┼──────────────────────────────┼───────────┤
│ DB_760 │ 192.168.0.93 │ 3306 │ 0           │ Slave, Running               │ 0-38001-8 │
└────────┴──────────────┴──────┴─────────────┴──────────────────────────────┴───────────┘

As we can see, the current master is DB_757 (192.168.0.90). Take note of this information as we are going to setup the binlog server to replicate from this master.

Open the MaxScale configuration file at /etc/maxscale.cnf and add the following lines:

[replication-service]
type=service
router=binlogrouter
user=maxscale_slave
password=BtF2d2Kc8H
version_string=10.4.12-MariaDB-log
server_id=9999
master_id=9999
mariadb10_master_gtid=true
filestem=binlog
binlogdir=/var/lib/maxscale/binlogs
semisync=true # if semisync is enabled on the master

[binlog-server-listener]
type=listener
service=replication-service
protocol=MariaDBClient
port=5306
address=0.0.0.0

A bit of explanation - We are creating two components - service and listener. Service is where we define the binlog server characteristic and how it should run. Details on every option can be found here. In this example, our replication servers are running with semi-sync replication, thus we have to use semisync=true so it will connect to the master via semi-sync replication method. The listener is where we map the listening port with the binlogrouter service inside MaxScale.

Restart MaxScale to load the changes:

$ systemctl restart maxscale

Verify the binlog service is started via maxctrl (look at the State column):

$ maxctrl show service replication-service

Verify that MaxScale is now listening to a new port for the binlog service:

$ netstat -tulpn | grep maxscale
tcp        0 0 0.0.0.0:3306            0.0.0.0:* LISTEN   4850/maxscale
tcp        0 0 0.0.0.0:3307            0.0.0.0:* LISTEN   4850/maxscale
tcp        0 0 0.0.0.0:5306            0.0.0.0:* LISTEN   4850/maxscale
tcp        0 0 127.0.0.1:8989          0.0.0.0:* LISTEN   4850/maxscale

We are now ready to establish a replication link between MaxScale and the master.

Activating the Binlog Server

Log into the MariaDB master server and retrieve the current binlog file and position:

MariaDB> SHOW MASTER STATUS;
+---------------+----------+--------------+------------------+
| File          | Position | Binlog_Do_DB | Binlog_Ignore_DB |
+---------------+----------+--------------+------------------+
| binlog.000005 |     4204 |              |                  |
+---------------+----------+--------------+------------------+

Use BINLOG_GTID_POS function to get the GTID value:

MariaDB> SELECT BINLOG_GTID_POS("binlog.000005", 4204);
+----------------------------------------+
| BINLOG_GTID_POS("binlog.000005", 4204) |
+----------------------------------------+
| 0-38001-31                             |
+----------------------------------------+

Back to the MaxScale server, install MariaDB client package:

$ yum install -y mysql-client

Connect to the binlog server listener on port 5306 as maxscale_slave user and establish a replication link to the designated master. Use the GTID value retrieved from the master:

(maxscale)$ mysql -u maxscale_slave -p'BtF2d2Kc8H' -h127.0.0.1 -P5306
MariaDB> SET @@global.gtid_slave_pos = '0-38001-31';
MariaDB> CHANGE MASTER TO MASTER_HOST = '192.168.0.90', MASTER_USER = 'maxscale_slave', MASTER_PASSWORD = 'BtF2d2Kc8H', MASTER_PORT=3306, MASTER_USE_GTID = slave_pos;
MariaDB> START SLAVE;
MariaDB [(none)]> SHOW SLAVE STATUS\G
*************************** 1. row ***************************
                 Slave_IO_State: Binlog Dump
                  Master_Host: 192.168.0.90
                  Master_User: maxscale_slave
                  Master_Port: 3306
             Slave_IO_Running: Yes
            Slave_SQL_Running: Yes
             Master_Server_Id: 38001
             Master_Info_File: /var/lib/maxscale/binlogs/master.ini
      Slave_SQL_Running_State: Slave running
                  Gtid_IO_Pos: 0-38001-31

Note: The above output has been truncated to show only important lines.

Pointing Slaves to the Binlog Server

Now on mariadb2 and mariadb3 (the end slaves), change the master pointing to the MaxScale binlog server. Since we are running with semi-sync replication enabled, we have to turn them off first:

(mariadb2 & mariadb3)$ mysql -uroot -p
MariaDB> STOP SLAVE;
MariaDB> SET global rpl_semi_sync_master_enabled = 0; -- if semisync is enabled
MariaDB> SET global rpl_semi_sync_slave_enabled = 0; -- if semisync is enabled
MariaDB> CHANGE MASTER TO MASTER_HOST = '192.168.0.95', MASTER_USER = 'maxscale_slave', MASTER_PASSWORD = 'BtF2d2Kc8H', MASTER_PORT=5306, MASTER_USE_GTID = slave_pos;
MariaDB> START SLAVE;
MariaDB> SHOW SLAVE STATUS\G
*************************** 1. row ***************************
                Slave_IO_State: Waiting for master to send event
                   Master_Host: 192.168.0.95
                   Master_User: maxscale_slave
                   Master_Port: 5306
              Slave_IO_Running: Yes
             Slave_SQL_Running: Yes
              Master_Server_Id: 9999
                    Using_Gtid: Slave_Pos
                   Gtid_IO_Pos: 0-38001-32
       Slave_SQL_Running_State: Slave has read all relay log; waiting for the slave I/O thread to update it

Note: The above output has been truncated to show only important lines.

Inside my.cnf, we have to comment the following lines to disable semi-sync in the future:

#loose_rpl_semi_sync_slave_enabled=ON
#loose_rpl_semi_sync_master_enabled=ON

At this point, the intermediate master (mariadb1) is still replicating from the master (mariadb0) while other slaves have been replicating from the binlog server. Our current topology can be illustrated like the diagram below:

The final part is to change the master pointing of the intermediate master (mariadb1) after all slaves that used to attach to it are no longer there. The steps are basically the same with the other slaves:

(mariadb1)$ mysql -uroot -p
MariaDB> STOP SLAVE;
MariaDB> SET global rpl_semi_sync_master_enabled = 0; -- if semisync is enabled
MariaDB> SET global rpl_semi_sync_slave_enabled = 0; -- if semisync is enabled
MariaDB> CHANGE MASTER TO MASTER_HOST = '192.168.0.95', MASTER_USER = 'maxscale_slave', MASTER_PASSWORD = 'BtF2d2Kc8H', MASTER_PORT=5306, MASTER_USE_GTID = slave_pos;
MariaDB> START SLAVE;
MariaDB> SHOW SLAVE STATUS\G
*************************** 1. row ***************************
                Slave_IO_State: Waiting for master to send event
                   Master_Host: 192.168.0.95
                   Master_User: maxscale_slave
                   Master_Port: 5306
              Slave_IO_Running: Yes
             Slave_SQL_Running: Yes
              Master_Server_Id: 9999
                    Using_Gtid: Slave_Pos
                   Gtid_IO_Pos: 0-38001-32

Note: The above output has been truncated to show only important lines.

Don't forget to disable semi-sync replication in my.cnf as well:

#loose_rpl_semi_sync_slave_enabled=ON
#loose_rpl_semi_sync_master_enabled=ON

We can the verify the binlog router service has more connections now via maxctrl CLI:

$ maxctrl list services
┌─────────────────────┬────────────────┬─────────────┬───────────────────┬───────────────────────────────────┐
│ Service             │ Router         │ Connections │ Total Connections │ Servers                           │
├─────────────────────┼────────────────┼─────────────┼───────────────────┼───────────────────────────────────┤
│ rw-service          │ readwritesplit │ 1           │ 1                 │ DB_757, DB_758, DB_759, DB_760    │
├─────────────────────┼────────────────┼─────────────┼───────────────────┼───────────────────────────────────┤
│ rr-service          │ readconnroute  │ 1           │ 1                 │ DB_757, DB_758, DB_759, DB_760    │
├─────────────────────┼────────────────┼─────────────┼───────────────────┼───────────────────────────────────┤
│ replication-service │ binlogrouter   │ 4           │ 51                │ binlog_router_master_host, DB_757 │
└─────────────────────┴────────────────┴─────────────┴───────────────────┴───────────────────────────────────┘

Also, common replication administration commands can be used inside the MaxScale binlog server, for example, we can verify the connected slave hosts by using this command:

(maxscale)$ mysql -u maxscale_slave -p'BtF2d2Kc8H' -h127.0.0.1 -P5306
MariaDB> SHOW SLAVE HOSTS;
+-----------+--------------+------+-----------+------------+
| Server_id | Host         | Port | Master_id | Slave_UUID |
+-----------+--------------+------+-----------+------------+
| 38003     | 192.168.0.92 | 3306 | 9999      |            |
| 38002     | 192.168.0.91 | 3306 | 9999      |            |
| 38004     | 192.168.0.93 | 3306 | 9999      |            |
+-----------+--------------+------+-----------+------------+

At this point, our topology is looking as what we anticipated:

Our migration from intermediate master setup to binlog server setup is now complete.


Preparing a MySQL or MariaDB Server for Production - Part One

$
0
0

It is extremely important to install and configure a production MySQL server with the necessary packages and tools to smooth-out the operations in the long run. We have seen many cases where troubleshooting or tuning a production server (especially one without public internet access) is commonly difficult because of the lack of necessary tools installed on the server to help identify and solve the problem. 

In this two-part blog series, we are going to show you 9 tips and tricks on how to prepare a MySQL server for production usage from a system administrator perspective. All examples in this blog post are based on our two-node, master-slave MySQL Replication setup running on CentOS 7.

Install Essential Packages

After the installation of MySQL or MariaDB client and server packages, we need to prepare the MySQL/MariaDB server with all necessary tools to cope with all the administration, management and monitoring operations that are going to happen on the server. If you are planning to lock down the MySQL server in production, it will be a bit harder to install them all manually without the Internet connection. 

Some of the important packages that should be installed on the MySQL/MariaDB server for Linux:

  • Percona Xtrabackup/MariaDB Backup - Non-blocking physical backup of the database server.
  • ntp/ntpdate - Sync server's time.
  • pv - Monitor data through a pipeline, can also be used for throttling.
  • socat or netcat- Data streaming tool, good for streaming backup.
  • net-tools - A collection of network debugging tools for Linux.
  • bind-utils - A collection of DNS debugging tools for Linux.
  • sysstat - A collection of performance monitoring tools for Linux.
  • telnet - Telnet client to check service reachability.
  • mailx/mailutils - MTA client.
  • openssl - Toolkit for the Transport Layer Security (TLS) and Secure Sockets Layer (SSL) protocols.
  • unzip - Uncompress tool.
  • htop - Host monitoring tool.
  • innotop - MySQL monitoring tool.
  • vim - Text editor with syntax highlighting (or any preferred text editor).
  • python-setuptools - Python package manager.
  • lm_sensors/ipmitool - To check server component's temperature. Bare-metal server only.

Note that some of the suggested packages are only available in non-default package repositories like EPEL for CentOS. Therefore, for YUM-based installation:

$ yum install epel-release
$ yum install -y wget ntp pv socat htop innotop vim mailx bind-utils net-tools telnet sysstat openssl python-setuptools lm_sensors ipmitool

While for APT-based installation:

$ apt-get install ntp pv socat htop innotop vim easy_install mailutils bind-utils sysstat net-tools telnet openssl lm_sensors ipmitool

For MySQL command line interface, we can use another tool other than the standard "mysql" command line client like mycli, with auto-completion and syntax highlighting. To install the package, we can use pip (Python package manager):

$ pip install mycli

With mycli, one can reduce the human-error vector with a better visualization when dealing with production server, as shown in the following screenshot:

Meaningful Shell Prompt

This part looks unnecessary in the first place, but it is probably going to save you from making silly mistakes in production. As a human, we are prone to make errors especially when running destructive commands during an intense moment, for example when the production server is down.

Take a look at the following screenshot. By default, the bash PS1 prompt (primary prompt) looks pretty dull:

A good PS1 prompt should provide distinctful information to make SysAdmins more aware of the environment, server and current path that they are currently dealing with. As a result, one would be more careful and always know whether it's in the right path/server/user to execute the command.

To achieve this, find the line that describing PS1 (primary prompt) configuration, commonly in /etc/bashrc line 41:

  [ "$PS1" = "\\s-\\v\\\$ " ] && PS1="[\u@\h \W]\\$ "

And replace it with this line:

  [ "$PS1" = "\\s-\\v\\\$ " ] && PS1="[\[\e[36m\]\u\[\e[m\]@\[\e[32m\]\h\[\e[m\]\[\e[31;47m\]Production\[\e[m\]: \[\e[33m\]\w\[\e[m\]]$ "

Log out from the terminal and re-login again. You should see something like this in the terminal now:

As shown in the screenshot above, the current user (blue), server's hostname (green), Production tier (bold in red colour with white background), together with the full path of the current directory (yellow) provides a better summary of the current session where the important information are easily distinguishable with different colours.

You can use this free online tool to customize your bash prompt, to suit your taste.

MOTD

If you are managing a database cluster with multiple roles like MySQL or MariaDB replication, it's common to always have this anxious feeling when directly administering one of the hosts because we need to perform extra checks to verify that the node that we are in is the one that we really want to administer. Replication topology tends to become more complex as your database cluster scales out and there could be many roles in a cluster like intermediate master, binlog server, backup master with semi-sync replication, read-only slaves and also backup verification server.

It will be way better if we can get a summary of the database state whenever we are in that particular server, just to give us a heads up on what we are going to deal with. We can utilize Linux's Message of the Day (MOTD) to automate this behaviour whenever we log into the server. Using the default /etc/motd is only good for static content, which is not what we really want if we want to report the current state of a MySQL server.

To achieve similar result, we can use a simple Bash script to produce a meaningful MOTD output to summarize our MySQL/MariaDB server, for example:

$ vim ~/.motd.sh
#!/bin/bash
# Auto-generate MOTD for MySQL/MariaDB Replication
# .motd.sh, to be executed under ~/.bash_profile

#####
# Preferred role of the node, pick one
#PREFER_ROLE='Slave'
PREFER_ROLE='Master'
#####

HOSTNAME=$(hostname)
UPTIME=$(uptime -p)
MYSQL_COMMAND='mysql --connect-timeout=2 -A -Bse'
MYSQL_READONLY=$(${MYSQL_COMMAND} 'SHOW GLOBAL VARIABLES LIKE "read_only"' | awk {'print $2'})
TIER='Production'
MAIN_IP=$(hostname -I | awk {'print $1'})
CHECK_MYSQL_REPLICATION=$(${MYSQL_COMMAND} 'SHOW SLAVE STATUS\G' | egrep 'Slave_.*_Running: Yes$')
MYSQL_MASTER=$(${MYSQL_COMMAND} 'SHOW SLAVE STATUS\G' | grep Master_Host | awk {'print $2'})
# The following requires show_compatibility_56=1 for MySQL 5.7 and later
MYSQL_UPTIME=$(${MYSQL_COMMAND} 'SELECT TIME_FORMAT(SEC_TO_TIME(VARIABLE_VALUE ),"%Hh %im")  AS Uptime FROM information_schema.GLOBAL_STATUS WHERE VARIABLE_NAME="Uptime"')

# coloring
bold=$(tput bold)
red=$(tput setaf 1)
green=$(tput setaf 2)
normal=$(tput sgr0)

MYSQL_SHOW=1
if [ $MYSQL_READONLY == 'ON' ]; then
        CURRENT_MYSQL_ROLE='Slave'
        if ${MYSQL_COMMAND} 'SHOW SLAVE STATUS\G' | egrep 'Slave_.*_Running: Yes$'&>/dev/null ; then
                lag=$(${MYSQL_COMMAND} 'SHOW SLAVE STATUS\G' | egrep 'Seconds_Behind_Master:' | awk {'print $2'})
                if [ $lag -eq 0 ]; then
                        REPLICATION_STATUS="${green}Healthy  "
                else
                        if [ $lag == 'NULL' ]; then
                                REPLICATION_STATUS=${red}Unhealthy
                        else
                                REPLICATION_STATUS="${red}Lagging ${lag}s"
                        fi
                fi
        else
                REPLICATION_STATUS=${red}Unhealthy
        fi

elif [ $MYSQL_READONLY == 'OFF' ]; then
        CURRENT_MYSQL_ROLE='Master'
        SLAVE_HOSTS=$(${MYSQL_COMMAND} 'SHOW SLAVE HOSTS' | awk {'print $1'})
else
        MYSQL_SHOW=0
fi

if [ $TIER == 'Production' ]; then
        TIER=${green}Production
fi

if [ $PREFER_ROLE == $CURRENT_MYSQL_ROLE ]; then
        MYSQL_ROLE=${green}$CURRENT_MYSQL_ROLE
else
        MYSQL_ROLE=${red}$CURRENT_MYSQL_ROLE
fi

echo
echo "HOST INFO"
echo "========="
echo -e "  Hostname       : ${bold}$HOSTNAME${normal} \t Server Uptime  : ${bold}$UPTIME${normal}"
echo -e "  IP Address       : ${bold}$MAIN_IP${normal} \t Tier           : ${bold}$TIER${normal}"
echo
if [ $MYSQL_SHOW -eq 1 ]; then
        echo "MYSQL STATE"
        echo "==========="
        echo -e "  Current role      : ${bold}$MYSQL_ROLE${normal} \t\t Read-only      : ${bold}$MYSQL_READONLY${normal}"
        echo -e "  Preferred role    : ${bold}$PREFER_ROLE${normal} \t\t DB Uptime      : ${bold}$MYSQL_UPTIME${normal}"
        if [ $CURRENT_MYSQL_ROLE == 'Slave' ]; then
                echo -e "  Replication state : ${bold}$REPLICATION_STATUS${normal} \t Current Master : ${bold}$MYSQL_MASTER${normal}"
        else
                echo -e "  Slave Hosts(s) ID : "
                for i in $SLAVE_HOSTS; do
                        echo -e "      - ${bold}$i${normal} \t"; done
        fi
        echo
fi

Choose one of the MySQL roles, either a master or a slave on line 8 or 9 and save the script. This script requires MySQL option file to store the database user credentials, so we have to create it first:

$ vim ~/.my.cnf

And add the following lines:

[client]
user=root
password='YourRootP4ssw0rd'

Replace the password part with the actual MySQL root password. Then, apply executable permission to the script:

$ chmod 755 ~/.motd.sh

Test the executable script whether it produces the correct output or not:

$ ~/.motd.sh

If the output looks good (no errors or warnings), add the script into ~/.bash_profile so it will be automatically loaded when a user logs in:

$ whoami
root
$ echo '~/.motd.sh'>> ~/.bash_profile

Re-login the terminal and you should see something like this on the master:

While on the slave, you should see something like this:

Note that this script is specifically written for a simple MySQL/MariaDB one-tier master-slave replication. You probably have to modify the script if you have a more complex setup, or you want to use other MySQL clustering technology like Galera Cluster, Group Replication or NDB Cluster. The idea is to retrieve the database node status and information right when we logged in so we are aware of the current state of the database server that we are working on.

Sensors and Temperature

This part is commonly being ignored by many SysAdmins. Monitoring the temperatures is crucial as we do not want to get a big surprise if the server behaves unexpectedly when overheating. A physical server commonly consists of hundreds of electronic parts glued together in a box and are sensitive to temperature changes. One failed cooling fan could spike a CPU temperature to hit its hard limit, which eventually causes the CPU clock to be throttled down and affects the data processing performance as a whole.

We can use the lm-sensors package for this purpose. To install it, simply do:

$ yum install lm-sensors # apt-get install lm-sensors for APT

Then run the sensors-detect program to automatically determine which kernel modules you need to load to use lm_sensors most effectively:

$ sensors-detect

Answers all questions (commonly just accept all the suggested answers). Some hosts like virtual machines or containers do not support this module. Sensors really need to be at the hosts (bare-metal) level. Check out this list for more information.

Then, run the sensors command:

$ sensors
i350bb-pci-0203
Adapter: PCI adapter
loc1:         +53.0°C (high = +120.0°C, crit = +110.0°C)

power_meter-acpi-0
Adapter: ACPI interface
power1:        4.29 MW (interval =   1.00 s)

coretemp-isa-0000
Adapter: ISA adapter
Package id 0:  +55.0°C (high = +85.0°C, crit = +95.0°C)
Core 0:        +45.0°C (high = +85.0°C, crit = +95.0°C)
Core 1:        +51.0°C (high = +85.0°C, crit = +95.0°C)
Core 2:        +47.0°C (high = +85.0°C, crit = +95.0°C)
Core 3:        +51.0°C (high = +85.0°C, crit = +95.0°C)
Core 4:        +49.0°C (high = +85.0°C, crit = +95.0°C)
Core 5:        +48.0°C (high = +85.0°C, crit = +95.0°C)
Core 8:        +47.0°C (high = +85.0°C, crit = +95.0°C)
Core 9:        +49.0°C (high = +85.0°C, crit = +95.0°C)
Core 10:       +48.0°C (high = +85.0°C, crit = +95.0°C)
Core 11:       +48.0°C (high = +85.0°C, crit = +95.0°C)
Core 12:       +46.0°C (high = +85.0°C, crit = +95.0°C)
Core 13:       +49.0°C (high = +85.0°C, crit = +95.0°C)

coretemp-isa-0001
Adapter: ISA adapter
Package id 1:  +53.0°C (high = +85.0°C, crit = +95.0°C)
Core 0:        +46.0°C (high = +85.0°C, crit = +95.0°C)
Core 1:        +48.0°C (high = +85.0°C, crit = +95.0°C)
Core 2:        +47.0°C (high = +85.0°C, crit = +95.0°C)
Core 3:        +45.0°C (high = +85.0°C, crit = +95.0°C)
Core 4:        +46.0°C (high = +85.0°C, crit = +95.0°C)
Core 5:        +47.0°C (high = +85.0°C, crit = +95.0°C)
Core 8:        +47.0°C (high = +85.0°C, crit = +95.0°C)
Core 9:        +45.0°C (high = +85.0°C, crit = +95.0°C)
Core 10:       +45.0°C (high = +85.0°C, crit = +95.0°C)
Core 11:       +46.0°C (high = +85.0°C, crit = +95.0°C)
Core 12:       +46.0°C (high = +85.0°C, crit = +95.0°C)
Core 13:       +46.0°C (high = +85.0°C, crit = +95.0°C)

The above result shows the overall CPU temperature, together with its every CPU core. Another tool that we can use to see the overall state of the server components is ipmitool. To install, simply do:

$ yum -y install ipmitool

By running the following command, we can tell the overall state of the physical components in the server:

$ ipmitool sdr list full
Inlet_Temp       | 20 degrees C   | ok
PCIe_Inlet_Temp  | 37 degrees C   | ok
Outlet_Temp      | 20 degrees C   | ok
CPU0_VR_Temp     | 39 degrees C   | ok
CPU1_VR_Temp     | 41 degrees C   | ok
CPU0_Temp        | 55 degrees C   | ok
CPU1_Temp        | 52 degrees C   | ok
PCH_Temp         | 58 degrees C   | ok
DIMMG0_Temp      | 35 degrees C   | ok
DIMMG1_Temp      | 32 degrees C   | ok
PSU0_Temp        | 0 degrees C    | ok
PSU1_Temp        | 0 degrees C    | ok
SYS_3.3V         | 3.30 Volts     | ok
SYS_5V           | 5 Volts        | ok
SYS_12V          | 12.10 Volts    | ok
CPU0_VCORE       | 1.79 Volts     | ok
CPU1_VCORE       | 1.79 Volts     | ok
CPU0_DDR_VDD     | 1.23 Volts     | ok
CPU1_DDR_VDD     | 1.23 Volts     | ok
SYS_FAN1_Speed   | 4018 RPM   | ok
SYS_FAN2_Speed   | 4116 RPM   | ok
SYS_FAN3_Speed   | 4116 RPM   | ok
SYS_FAN4_Speed   | 4116 RPM   | ok
SYS_FAN5_Speed   | 4018 RPM   | ok
SYS_FAN6_Speed   | 4116 RPM   | ok
SYS_FAN7_Speed   | 4018 RPM   | ok
SYS_FAN8_Speed   | 4116 RPM   | ok
SYS_FAN9_Speed   | 4018 RPM   | ok
SYS_FAN10_Speed  | 4116 RPM   | ok
SYS_FAN11_Speed  | 4116 RPM   | ok
SYS_FAN12_Speed  | 4116 RPM   | ok
SYS_FAN13_Speed  | 4116 RPM   | ok
SYS_FAN14_Speed  | 4214 RPM   | ok
Airflow_rate     | 16 CFM     | ok
PSU1_PIN         | 0 Watts    | ok
PSU2_PIN         | 0 Watts    | ok
PSU1_POUT        | 0 Watts    | ok
PSU2_POUT        | 0 Watts    | ok
PSU1_IIN         | 0 Amps     | ok
PSU2_IIN         | 0 Amps     | ok
PSU1_VIN         | 0 Volts    | ok
PSU2_VIN         | 0 Volts    | ok
CPU_Power        | 63 Watts   | ok
MEM_Power        | 8 Watts    | ok
Total_Power      | 0 Watts    | ok
BP_Power         | 8 Watts    | ok
FAN_Power        | 6 Watts    | ok
MB_Power         | 0 Watts    | ok

The list is long but is self-explanatory and you should be able to oversee the overall server components' state. There could be cases where some of the fans are not running at full speed which then increase the CPU temperature. Hardware replacement might be required to fix the problem.

Note that the Intelligent Platform Management Interface (IPMI) kernel module requires Baseboard Management Controller (BMC) to be enabled on the motherboard. Use dmesg to verify if it is available:

$ dmesg | grep -i bmc
[    8.063470] ipmi_si IPI0001:00: Found new BMC (man_id: 0x000000, prod_id: 0x02f3, dev_id: 0x20)

Otherwise, check the server's BIOS setting if this controller is disabled.

That's it for now. Part two of this blog series will cover the remaining 5 topics like backup tool configuration, stress tests, and server lock down.


Preparing a MySQL or MariaDB Server for Production - Part Two

$
0
0

In the previous blog, we have covered some tips and tricks to prepare a MySQL server for production usage from a system administrator perspective. This blog post is the continuation... 

Use a Database Backup Tool

Every backup tool has its own advantages and disadvantages. For example, Percona Xtrabackup (or MariaDB Backup for MariaDB) can perform a physical hot-backup without locking the databases but it can only be restored to the same version on another instance. While for mysqldump, it is cross compatible with other MySQL major versions and way simpler for partial backup, albeit it is relatively slower during restoration if compared to Percona Xtrabackup on big databases. MySQL 5.7 also introduces mysqlpump, similar to mysqldump with parallel processing capabilities to speed up the dump process.

Do not miss to configure all of these backup tools in your MySQL server as they are freely available and very critical for data recovery. Since mysqldump and mysqlpump are already included in MySQL 5.7 and later, we just need to install Percona Xtrabackup (or MariaDB Backup for MariaDB) but it requires some preparations, as shown in the following steps:

Step One

Make sure the backup tool and its dependencies are installed:

$ yum install -y epel-release
$ yum install -y socat pv percona-xtrabackup

For MariaDB servers, use MariaDB Backup instead:

$ yum install -y socat pv MariaDB-Backup

Step Two

Create user 'xtrabackup' on master if it doesn't exist:

mysql> CREATE USER 'xtrabackup'@'localhost' IDENTIFIED BY 'Km4z9^sT2X';
mysql> GRANT RELOAD, LOCK TABLES, PROCESS, REPLICATION CLIENT ON *.* TO 'xtrabackup'@'localhost';

Step Three

Create another user called 'mysqldump' on master if it doesn't exist. This user will be used for 'mysqldump' and 'mysqlpump':

mysql> CREATE USER 'mysqldump'@'localhost' IDENTIFIED BY 'Km4z9^sT2X';
mysql> GRANT SELECT, SHOW VIEW, EVENT, TRIGGER, LOCK TABLES, RELOAD, REPLICATION CLIENT ON *.* TO 'mysqldump'@'localhost';

Step Four

Add the backup users' credentials inside MySQL configuration file under [xtrabackup], [mysqldump] and [mysqlpump] directive:

$ cat /etc/my.cnf

...

[xtrabackup]
user=xtrabackup
password='Km4z9^sT2X'

[mysqldump]
user=mysqldump
password='Km4z9^sT2X'

[mysqlpump]
user=mysqldump
password='Km4z9^sT2X'

By specifying the above lines, we don't need to specify username and password in the backup command since the backup tool will automatically load those configuration options from the main configuration file.

Make sure the backup tools are properly tested beforehand. For Xtrabackup which supports backup streaming via network, this has to be tested first to make sure the communication link can be established correctly between the source and destination server. On the destination server, run the following command for socat to listen to port 9999 and ready to accept incoming streaming:

$ socat -u tcp-listen:9999,reuseaddr stdout 2>/tmp/netcat.log | xbstream -x -C /var/lib/mysql

Then, create a backup on the source server and stream it to port 9999 on the destination server:

$ innobackupex --socket=/var/lib/mysql/mysql.sock --stream=xbstream /var/lib/mysql/ | socat - TCP4:192.168.0.202:9999

You should get a continuous stream of output after executing the backup command. Wait until you see the 'Completed OK' line indicating a successful backup.

With pv, we can throttle the bandwidth usage or see the progress as a process being piped through it. Commonly, the streaming process will saturate the network if no throttleting is enabled and this could cause problems with other servers to interact with another in the same segment. Using pv, we can throttle the streaming process before we pass it to the streaming tool like socat or netcat. The following example shows the backup streaming will be throttled around 80 MB/s for both incoming and outgoing connections:

$ innobackupex --slave-info --socket=/var/lib/mysql/mysql.sock --stream=xbstream /var/lib/mysql/ | pv -q -L 80m | socat - TCP4:192.168.0.202:9999

Streaming a backup is commonly used to stage a slave or store the backup remotely on another server.

For mysqldump and mysqlpump, we can test with the following commands:

$ mysqldump --set-gtid-purged=OFF --all-databases
$ mysqlpump --set-gtid-purged=OFF --all-databases

Make sure you see non-error lines appear in the output.

Stress Test the Server

Stress testing the database server is important to understand the maximum capacity that we can anticipate for the particular server. This will become useful when you are approaching thresholds or bottlenecks at a later stage. You can use many benchmarking tools available in the market like mysqlslap, DBT2 and sysbench. 

In this example, we use sysbench to measure the server's peak performance, saturation level and also the components' temperature while running in a high database workload environment. This will give you a ground understanding on how good the server is, and anticipate the workload that the server can process for our application in production.

To install and configure sysbench, you can compile it from the source or install the package from Percona repository:

$ yum install -y https://repo.percona.com/yum/percona-release-latest.noarch.rpm
$ yum install -y sysbench

Create the database schema and user on the MySQL server:

mysql> CREATE DATABASE sbtest;
mysql> CREATE USER 'sbtest'@'localhost' IDENTIFIED BY 'sysbenchP4ss';
mysql> GRANT ALL PRIVILEGES ON sbtest.* TO sbtest@'localhost';

Generate the test data:

$ sysbench \
/usr/share/sysbench/oltp_common.lua \
--db-driver=mysql \
--mysql-host=localhost \
--mysql-user=sbtest \
--mysql-password=sysbenchP4ss \
--tables=50 \
--table-size=100000 \
prepare

Then run the benchmark for 1 hour (3600 seconds):

$ sysbench \
/usr/share/sysbench/oltp_read_write.lua \
--report-interval=2 \
--threads=64 \
--max-requests=0 \
--db-driver=mysql \
--time=3600 \
--db-ps-mode=disable \
--mysql-host=localhost \
--mysql-user=sbtest \
--mysql-password=sysbenchP4ss \
--tables=50 \
--table-size=100000 \
run

While the test is running, use iostat (available in sysstat package) in another terminal to monitor the disk utilization, bandwidth, IOPS and I/O wait:

$ yum install -y sysstat
$ iostat -x 60

avg-cpu:  %user %nice %system %iowait  %steal %idle
          40.55    0.00 55.27    4.18 0.00 0.00

Device:         rrqm/s wrqm/s     r/s w/s rkB/s    wkB/s avgrq-sz avgqu-sz   await r_await w_await svctm  %util
sda               0.19 6.18 1236.23  816.92 61283.83 14112.44    73.44 4.00 1.96 2.83    0.65 0.34 69.29

The above result will be printed every 60 seconds. Wait until the test finishes and take the average of r/s (reads/second), w/s (writes/second), %iowait, %util, rkB/s and wkB/s (bandwidth). If you are seeing a relatively low utilization of disk, CPU, RAM or network, you probably need to increase the "--threads" value to an even higher number so it will make use of all the resources to the limit.

Consider the following aspects to be measured of:

  • Queries per Second = Sysbench summary once the test completes under SQL statistics -> Queries -> Per sec.
  • Query latency = Sysbench summary once the test completes under Latency (ms) -> 95th percentile.
  • Disk IOPS = Average of r/s + w/s
  • Disk utilization = Average of %util
  • Disk bandwidth R/W = Average of rkB/s / Average of wkB/s
  • Disk IO wait = Average of %iowait
  • Average server load = Average load average as reported by top command.
  • MySQL CPU usage = Average CPU utilization as reported by top command.

With ClusterControl, you can easily observe and get the above information via Nodes Overview panel, as shown in the following screenshot:

Furthermore, the information gathered during the stress test can be used to tune MySQL and InnoDB variables accordingly like innodb_buffer_pool_size, innodb_io_capacity, innodb_io_capacity_max, innodb_write_io_threads, innodb_read_io_threads and also max_connections.

To learn more about MySQL performance benchmark using sysbench, check out this blog post, How to Benchmark Performance of MySQL & MariaDB Using SysBench.

Use an Online Schema Change Tool

Schema change is something that is inevitable in relational databases. As the application grows and becomes more demanding over time, it does certainly require some structure change to the database. There are some DDL operations that will rebuild the table thus blocking other DML statements to run and this could impact your database availability if you are performing structural changes on a huge table. To see the list of blocking DDL operations, check out this MySQL documentation page and look for operations that have "Permits Concurrent DML" = No.

If you can't afford downtime on the production servers when performing schema change, it's probably a good idea to configure the online schema change tool at the early stage. In this example, we install and configure gh-ost, an online schema change built by Github. Gh-ost uses the binary log stream to capture table changes and asynchronously applies them onto the ghost table.

To install gh-ost on a CentOS box, simply follow the following steps: 

Step One

 Download latest gh-ost from here

$ wget https://github.com/github/gh-ost/releases/download/v1.0.48/gh-ost-1.0.48-1.x86_64.rpm

Step Two

Install the package:

$ yum localinstall gh-ost-1.0.48-1.x86_64.rpm 

Step Three

Create a database user for gh-ost if it does not exist, and grant it with proper privileges:

mysql> CREATE USER 'gh-ost'@'{host}' IDENTIFIED BY 'ghostP455';
mysql> GRANT ALTER, CREATE, DELETE, DROP, INDEX, INSERT, LOCK TABLES, SELECT, TRIGGER, UPDATE ON {db_name}.* TO 'gh-ost'@'{host}';
mysql> GRANT SUPER, REPLICATION SLAVE ON *.* TO 'gh-ost'@'{host}';

** Replace the {host} and {db_name} with their appropriate values. Ideally, the {host} is one of the slave hosts that will perform the online schema change. Refer to gh-ost documentation for details.

Step Four

Create gh-ost configuration file to store the username and password under /root/.gh-ost.cnf:

[client]
user=gh-ost
password=ghostP455

Similarly, you can have Percona Toolkit Online Schema Change (pt-osc) configured on the database server. The idea is to make sure you are prepared with this tool first on the database server that is likely to be running this operation in the future.

Utilize the Percona Toolkit

Percona Toolkit is a collection of advanced open source command-line tools, developed by Percona, that are engineered to perform a variety of MySQL, MongoDB and PostgreSQL server and system tasks that are too difficult or complex to perform manually. These tools have become the ultimate saviour, used by DBAs around the world to address or solve technical issues found in MySQL and MariaDB servers.

To install Percona Toolkit, simply run the following command:

$ yum install https://repo.percona.com/yum/percona-release-latest.noarch.rpm
$ yum install percona-toolkit

There are over 30 tools available within this package. Some of them are specifically designed for MongoDB and PostgreSQL. Some of the most popular tools for MySQL troubleshooting and performance tuning are pt-stalk, pt-mysql-summary, pt-query-digest, pt-table-checksum, pt-table-sync and pt-archiver. This toolkit can help DBAs to verify MySQL replication integrity by checking master and replica data consistency, efficiently archive rows, find duplicate indexes, analyze MySQL queries from logs and tcpdump and much more.

The following example shows one of the tools (pt-table-checksum) output where it can perform online replication consistency check by executing checksum queries on the master, which produces different results on replicas that are inconsistent with the master:

$ pt-table-checksum --no-check-binlog-format --replicate-check-only
Checking if all tables can be checksummed ...
Starting checksum ...

Differences on mysql2.local

TABLE CHUNK CNT_DIFF CRC_DIFF CHUNK_INDEX LOWER_BOUNDARY UPPER_BOUNDARY
mysql.proc 1 0 1
mysql.tables_priv 1 0 1
mysql.user 1 1 1

The above output shows that there are 3 tables on the slave (mysql2.local) which are inconsistent with the master. We can then use the pt-table-sync tool to patch up the missing data from the master, or simply resyncing the slave once more.

Lock Down the Server

Finally, after the configuration and preparation stage is complete, we can isolate the database node from the public network and restrict the server access to known hosts and networks. You can use firewall (iptables, firewalld, ufw), security groups, hosts.allow and/or hosts.deny or simply disable the network interface that faces the internet if you have multiple network interfaces.

For iptables, it's important to specify a comment for every rule using the '-m comment --comment' flag:

$ iptables -A INPUT -p tcp -s 192.168.0.0/24 --dport 22 -m comment --comment 'Allow local net to SSH port' -j ACCEPT
$ iptables -A INPUT -p tcp -s 192.168.0.0/24 --dport 3306 -m comment --comment 'Allow local net to MySQL port' -j ACCEPT
$ iptables -A INPUT -p tcp -s 192.168.0.0/24 --dport 9999 -m comment --comment 'Allow local net to backup streaming port' -j ACCEPT
$ iptables -A INPUT -p tcp -s 0.0.0.0/0 -m comment --comment 'Drop everything apart from the above' -j DROP

Similarly for Ubuntu's Firewall (ufw), we need to define the default rule first and then can create a similar rules for MySQL/MariaDB similar to this:

$ sudo ufw default deny incoming comment 'Drop everything apart from the above'
$ sudo ufw default allow outgoing comment 'Allow outgoing everything'
$ sudo ufw allow from 192.168.0.0/24 to any port 22 comment 'Allow local net to SSH port'
$ sudo ufw allow from 192.168.0.0/24 to any port 3306 comment 'Allow local net to MySQL port'
$ sudo ufw allow from 192.168.0.0/24 to any port 9999 comment 'Allow local net to backup streaming port'

Enable the firewall:

$ ufw enable

Then, verify the rules are loaded correctly:

$ ufw status verbose
Status: active
Logging: on (low)
Default: deny (incoming), allow (outgoing), disabled (routed)

New profiles: skip

To                         Action From
--                         ------ ----
22                         ALLOW IN 192.168.0.0/24             # Allow local net to SSH port
3306                       ALLOW IN 192.168.0.0/24             # Allow local net to MySQL port
9999                       ALLOW IN 192.168.0.0/24             # Allow local net to backup streaming port

Again, it's very important to specify comments on every rule to help us understand the rule better.

For remote database access restriction, we can also use VPN server as shown in this blog post, Using OpenVPN to Secure Access to Your Database Cluster in the Cloud

Conclusion

Preparing a production server is obviously not an easy task, which we have shown in this blog series. If you are worried that you would screw up, why don't you use ClusterControl to deploy your database cluster? ClusterControl has a very good track record in database deployment and has enabled more than 70,000 MySQL and MariaDB deployments for all environments to date. 


Comparing Amazon RDS Point-in-Time Recovery to ClusterControl

$
0
0

The Amazon Relational Database Service (AWS RDS) is a fully-managed database service which can support multiple database engines. Among those supported are PostgreSQL, MySQL, and MariaDB. ClusterControl, on the other hand, is a database management and automation software which also supports backup handling for PostgreSQL, MySQL, and MariaDB open source databases. 

While RDS has been widely embraced by many companies, some might not be familiar with how their Point-in-time Recovery (PITR) works and how it can be used. 

Several of the database engines used by Amazon RDS have special considerations when restoring from a specific point in time, and in this blog we'll cover how it works for PostgreSQL, MySQL, and MariaDB. We'll also compare how it differs with the PITR function in ClusterControl.

What is Point-in-Time Recovery (PITR)

If you are not yet familiar with Disaster Recovery Planning (DRP) or Business Continuity Planning (BCP), you should know that PITR is one of the important standard practices for database management. As mentioned in our previous blog, Point In Time Recovery (PITR) involves restoring the database at any given moment in the past. To be able to do this, we will need to restore a full backup and then PITR takes place by applying all the changes that happened at a specific point in time you want to recover. 

Point-in-time Recovery (PITR) with AWS RDS

AWS RDS handles PITR differently than the traditional way common to an on-prem database. The end result shares the same concept, but with AWS RDS the full backup is a snapshot, it then applies the PITR (which is stored in S3), and then launches a new (different) database instance. 

The common way requires you to either use a logical (using pg_dump, mysqldump, mydumper) or a physical (Percona Xtrabackup, Mariabackup, pg_basebackup, pg_backrest) for your full backup before you apply the PITR. 

AWS RDS will require you to launch a new DB instance, whereas the traditional approach allows you to flexibly store the PITR on the same database node where backup was taken or target a different (existing) DB instance that needs recovery or to a fresh DB instance.

Upon creation of your AWS RDS instance automated backups will be turned on. Amazon RDS automatically performs a full daily snapshot of your data. Snapshot schedules can be set during creation at your preferred backup window. While automated backups are turned on, AWS also captures transaction logs to Amazon S3 every 5 minutes recording all your DB updates. Once you initiate a point-in-time recovery, transaction logs are applied to the most appropriate daily backup in order to restore your DB instance to the specific requested time.

How To Apply a PITR with AWS RDS

Applying PITR can be done in three different ways. You can use  AWS Management Console, the AWS CLI, or the Amazon RDS API once the DB instance is available. You must also take into consideration that the transaction logs are captured every five minutes which is then stored in AWS S3.

Once you restore a DB instance, the default DB security group (SG) is applied to the new DB instance. If you need the custom db SG, you can explicitly define this using  the AWS Management Console, the AWS CLI modify-db-instance command, or the Amazon RDS API ModifyDBInstance operation after the DB instance is available.

PITR requires that you need to identify the most latest restorable time for a DB instance. To do this, you can use the AWS CLI describe-db-instances command and look at the value returned in the LatestRestorableTime field for the DB instance. For example,

[root@ccnode ~]# aws rds describe-db-instances --db-instance-identifier database-s9s-mysql|grep LatestRestorableTime

            "LatestRestorableTime": "2020-05-08T07:25:00+00:00",

Applying PITR with AWS Console

To apply PITR in AWS Console, login to AWS Console→ go to Amazon RDS → Databases → Select (or click) your desired DB instance, then click Actions. See below,

Once you attempt to restore via PITR, the console UI will notify you what's the most latest restorable time you can set. You can use the latest restorable time or specify your desired target date and time. See below:

It's quite easy to follow but it requires you to pay attention and fill in the desired specifications you need for the new instance to be launched.

Applying PITR with AWS CLI

Using the AWS CLI can be quite handy especially if you need to incorporate this with your automation tools for your CI/CD pipeline. To do this, you can start simply with,

[root@ccnode ~]# aws rds restore-db-instance-to-point-in-time \

>     --source-db-instance-identifier  database-s9s-mysql \

>     --target-db-instance-identifier  database-s9s-mysql-pitr \

>     --restore-time 2020-05-08T07:30:00+00:00

{

    "DBInstance": {

        "DBInstanceIdentifier": "database-s9s-mysql-pitr",

        "DBInstanceClass": "db.t2.micro",

        "Engine": "mysql",

        "DBInstanceStatus": "creating",

        "MasterUsername": "admin",

        "DBName": "s9s",

        "AllocatedStorage": 18,

        "PreferredBackupWindow": "00:00-00:30",

        "BackupRetentionPeriod": 7,

        "DBSecurityGroups": [],

        "VpcSecurityGroups": [

            {

                "VpcSecurityGroupId": "sg-xxxxx",

                "Status": "active"

            }

        ],

        "DBParameterGroups": [

            {

                "DBParameterGroupName": "default.mysql5.7",

                "ParameterApplyStatus": "in-sync"

            }

        ],

        "DBSubnetGroup": {

            "DBSubnetGroupName": "default",

            "DBSubnetGroupDescription": "default",

            "VpcId": "vpc-f91bdf90",

            "SubnetGroupStatus": "Complete",

            "Subnets": [

                {

                    "SubnetIdentifier": "subnet-exxxxx",

                    "SubnetAvailabilityZone": {

                        "Name": "us-east-2a"

                    },

                    "SubnetStatus": "Active"

                },

                {

                    "SubnetIdentifier": "subnet-xxxxx",

                    "SubnetAvailabilityZone": {

                        "Name": "us-east-2c"

                    },

                    "SubnetStatus": "Active"

                },

                {

                    "SubnetIdentifier": "subnet-xxxxxx",

                    "SubnetAvailabilityZone": {

                        "Name": "us-east-2b"

                    },

                    "SubnetStatus": "Active"

                }

            ]

        },

        "PreferredMaintenanceWindow": "fri:06:01-fri:06:31",

        "PendingModifiedValues": {},

        "MultiAZ": false,

        "EngineVersion": "5.7.22",

        "AutoMinorVersionUpgrade": true,

        "ReadReplicaDBInstanceIdentifiers": [],

        "LicenseModel": "general-public-license",

        "OptionGroupMemberships": [

            {

                "OptionGroupName": "default:mysql-5-7",

                "Status": "pending-apply"

            }

        ],

        "PubliclyAccessible": true,

        "StorageType": "gp2",

        "DbInstancePort": 0,

        "StorageEncrypted": false,

        "DbiResourceId": "db-XXXXXXXXXXXXXXXXX",

        "CACertificateIdentifier": "rds-ca-2019",

        "DomainMemberships": [],

        "CopyTagsToSnapshot": false,

        "MonitoringInterval": 0,

        "DBInstanceArn": "arn:aws:rds:us-east-2:042171833148:db:database-s9s-mysql-pitr",

        "IAMDatabaseAuthenticationEnabled": false,

        "PerformanceInsightsEnabled": false,

        "DeletionProtection": false,

        "AssociatedRoles": []

    }

}

Both of these approaches take time to create or prepare the database instance until it will be available and viewable in the list of database instances in your AWS RDS console.

AWS RDS PITR Limitations

When using AWS RDS you are tied to them as a vendor. Moving your operations out their system can be troublesome. Here's are some things you have to consider:

  • The level of vendor-lock in when using AWS RDS
  • Your only option to recover via PITR requires you to launch a new instance running on RDS
  • No way you can recover using PITR process to an external node not in RDS
  • Requires you to learn and be familiar with their tools and security framework.

How To Apply A PITR with ClusterControl

ClusterControl performs PITR in a simple, yet straightforward, fashion (but requires you have to enable or set the prerequisites so PITR can be used). As discussed earlier, PITR for ClusterControl works differently than AWS RDS. Here a list of where PITR can be applied using ClusterControl (as of version 1.7.6):

  • Applies after the full backup based on the available backup method solutions we support for PostgreSQL, MySQL, and MariaDB databases. 
    • For PostgreSQL, only pg_basebackup backup method is supported and compatible to work with PITR
    • For MySQL or MariaDB, only xtrabackup/mariabackup backup method is supported and compatible to work with PITR
  • Applicable for MySQL or MariaDB databases, PITR applies only if the source node of the full backup is the target node to be recovered.
  •  MySQL or MariaDB databases requires that you have binary logging enabled
  • Applicable for PostgreSQL databases, PITR applies only to the active master/primary and requires that you have to enable WAL archiving.
  • PITR can only be applied when restoring an existing full backup

Backup Management for ClusterControl is applicable for environments where databases are not fully managed and requires SSH access which is totally different from AWS RDS. Although they share the same result which is to recover data, the backup solutions that are present in ClusterControl cannot be applicable in AWS RDS. ClusterControl also does not support RDS as well for management and monitoring.

Using ClusterControl for PITR in PostgreSQL

As mentioned earlier of the prerequisites to leverage the PITR, you must have to enable WAL archiving. This can be achieve by clicking the gear icon as shown below:

Since PITR can be applied right after a full backup, you can only run find this feature under the Backup list where you can attempt to restore an existing backup. To do that, the sequence of screenshots will show you how to do it:

Then restore it on the same host as the source of the backup as taken,

Then just specify the date and time,

Once you are set and specify the date and time, ClusterControl will then restore the backup then apply the PITR once the backup is done. You can also verify this by inspecting the job activity logs just like below,

Using ClusterControl for PITR in MySQL/MariaDB

PITR for MySQL or MariaDB does not differ from the approach we have above for PostgreSQL. However, there's no WAL archiving equivalence nor a button or option you can set that is required to enable the PITR functionality. Since MySQL and MariaDB require that a PITR can be applied using binary logs, in ClusterControl, this can be handled under Manage tab. See below:

Then specify the log_bin variable with the corresponding boolean value. For example,

Once the log_bin is set on the node, ensure that you have the full backup taken on the same node where you will also apply the process of PITR. This is stated earlier in the prerequisites. Alternatively, you can also just edit the configuration files (/etc/my.cnf or /etc/mysql/my.cnf) and add the log_bin=ON under the [mysqld] section, for example.

When binary logs are enabled and a full backup is available, you can then do the PITR process same as how PostgreSQL UI but with different fields that you can fill in. You can specify the date and time or specify based on the binlog's file and position (or x & y position). See below:

ClusterControl PITR Limitations

In case you’re wondering what you can and cannot do for PITR in ClusterControl, here's the list below:

  • There's no current s9s CLI tool which supports the PITR process, so it's not possible to automate or integrate to your CI/CD pipeline.
  • No PITR support for external nodes
  • No PITR support when the source of the backup is different from the target node
  • There's no such periodic notification of what's the most latest period of time you can apply for PITR

Conclusion

Both tools have different approaches and different solutions for the target environment. The key takeaways is that AWS RDS has its own PITR which is faster, but is applicable only if your database is hosted under RDS and you are tied to a vendor lock in

ClusterControl allows you to freely apply the PITR process to whatever data center or on-premise as long as the prerequisites are taken into consideration. It's goal is to recover the data. Regardless of its limitations, it's based on how you will use the solution in accordance to the architectural environment you are using.

Multi-Cloud Full Database Cluster Failover Options for MariaDB Cluster

$
0
0

With high availability being paramount in today’s business reality, one of the most common scenarios for users to deal with is how to ensure that the database will always be available for the application. 

Every service provider comes with an inherited risk of service disruption therefore one of the steps that can be taken are to rely on multiple providers to alleviate the risk and additional redundancy. 

Cloud service providers are no different - they can fail and you should plan for this in the advance. What options are available for MariaDB Cluster? Let’s take a look at it in this blog post.

MariaDB Database Clustering in Multi-Cloud Environments

If SLA proposed by one cloud service provider is not enough, there’s always an option to create a disaster recovery site outside of that provider. Thanks to this, whenever one of the cloud providers experiences some service degradation, you can always switch to another provider and keep your database up and available.

One of the problems that are typical for multi-cloud setups is the network latency that’s unavoidable if we are talking about larger distances or, in general, multiple geographically separated locations. Speed of light is quite high but it is finite, every hop, every router also adds some latency into the network infrastructure. 

MariaDB Cluster works great on low-latency networks. It is a quorum-based cluster where prompt communication between all nodes is required to keep the operations smooth. Increase in network latency will impact cluster operations, especially performance of the writes. There are several ways this problem can be addressed. 

First we have an option to use separate clusters connected using asynchronous replication links. This allows us to almost forget about latency because asynchronous replication is significantly better suited to work in high latency environments. 

Another option is that,  given low latency networks between datacenters, you still might be perfectly fine to run a MariaDB Cluster spanning across several data centers. After all, multiple datacenters don’t always mean vast distances geographically-wise - you can as well use multiple providers located within the same metropolitan area, connected with fast, low-latency networks. Then we’ll be talking about latency increase to tens of milliseconds at most, definitely not hundreds. It all depends on the application but such an increase may be acceptable.

Asynchronous Replication Between MariaDB Clusters

Let’s take a quick look at the asynchronous approach. The idea is simple - two clusters connected with each other using asynchronous replication. 

Asynchronous Replication Between MariaDB Clusters

This comes with several limitations. For starters, you have to decide if you want to use multi-master or would you send all traffic to one datacenter only. We would recommend to stay away from writing to both datacenters and using master - master replication. This may lead to serious issues if you do not exercise caution.

If you decide to use the active - passive setup, you would probably want to implement some sort of a DNS-based routing for writes, to make sure that your application servers will always connect to a set of proxies located in the active datacenter. This might be achieved by either literally DNS entry that would be changed when failover is required or it can be done through some sort of a service discovery solution like Consul or etcd.

The main downside of the environment built using the asynchronous replication is the lack of ability to deal with network splits between datacenters. This is inherited from the replication - no matter what you want to link with the replication (single nodes, MariaDB Clusters), there is no way to go around the fact that replication is not quorum-aware. There is no mechanism to track the state of the nodes and understand the high level picture of the whole topology. As a result, whenever the link between two datacenters goes down, you end up with two separate MariaDB clusters that are not connected and that are both ready to accept traffic. It will be up to the user to define what to do in such a case. It is possible to implement additional tools that would monitor the state of the databases from outside (i.e. from the third datacenter) and then take actions (or do not take actions) based on that information. It is also possible to collocate tools that would share the infrastructure with databases but would be cluster-aware and could track the state of the datacenter connectivity and be used as the source of truth for the scripts that would manage the environment. For example, ClusterControl can be deployed in a three-node cluster, node per datacenter, that uses RAFT protocol to ensure the quorum. If a node losts the connectivity with the rest of the cluster it could be assumed that the datacenter has experienced network partitioning.

Multi-DC MariaDB Clusters

Alternative to the asynchronous replication could be an all-MariaDB Cluster solution that spans across multiple datacenters.

Multi-DC MariaDB Clusters

As stated at the beginning of this blog, MariaDB Cluster, just like every Galera-based cluster, will be impacted by the high latency. Having said that, it is perfectly acceptable to run it in “not-so-high” latency environments and expect it to behave properly, delivering acceptable performance. It all depends on the network throughput and design, distance between datacenters and application requirements. Such an approach will work great especially if we use segments to differentiate separate data centers. It allows MariaDB Cluster to optimize its intra cluster connectivity and reduce cross-DC traffic to the minimum.

The main advantage of this setup is that it relies on MariaDB Cluster to handle failures. If you use three data centers, you are pretty much covered against the split-brain situation - as long as there is a majority, it will continue to operate. It is not required to have a full-blown node in the third datacenter - you can as well use Galera Arbitrator, a daemon that acts as a part of the cluster but it does not have to handle any database operations. It connects to the nodes, takes part in the quorum calculation and may be used to relay the traffic should the direct connection between the two data centers not work. 

In that case the whole failover process can be described as: define all nodes in the load balancers (all if data centers are close to each other, in other case you may want to add some priority for the nodes located closer to the load balancer) and that’s pretty much it. MariaDB Cluster nodes that form the majority will be reachable through any proxy.

Deploying a Multi-Cloud MariaDB Cluster Using ClusterControl

Let’s take a look at two options you can use to deploy multi-cloud MariaDB Clusters using ClusterControl. Please keep in mind that ClusterControl requires SSH connectivity to all of the nodes it will manage so it would be up to you to ensure network connectivity across multiple datacenters or cloud providers. As long as the connectivity is there, we can proceed with two methods.

Deploying MariaDB Clusters Using Asynchronous Replication

ClusterControl can help you to deploy two clusters connected using asynchronous replication. When you have a single MariaDB Cluster deployed, you want to ensure that one of the nodes has binary logs enabled. This will allow you to use that node as a master for the second cluster that we will create shortly.

Deploying MariaDB Clusters Using Asynchronous Replication

Once the binary log has been enabled, we can use Create Slave Cluster job to start the deployment wizard.

Deploying MariaDB Clusters Using Asynchronous Replication

We can either stream the data directly from the master or you can use one of the backups to provision the data.

Deploying MariaDB Clusters Using Asynchronous Replication

Then you are presented with a standard cluster deployment wizard where you have to pass SSH connectivity details.

Deploying MariaDB Clusters Using Asynchronous Replication

You will be asked to pick the vendor and version of the databases as well as asked for the password for the root user.

Deploying MariaDB Clusters Using Asynchronous Replication

Finally, you are asked to define nodes you would like to add to the cluster and you are all set.

Deploying MariaDB Clusters Using Asynchronous Replication

When deployed, you will see it on the list of the clusters in the ClusterControl UI.

Deploying Multi-Cloud MariaDB Cluster

As we mentioned earlier, another option to deploy MariaDB Cluster would be to use separate segments when adding nodes to the cluster. In the ClusterControl UI you will find an option to “Add Node”:

Deploying Multi-Cloud MariaDB Cluster

When you use it, you will be presented with following screen:

Deploying Multi-Cloud MariaDB Cluster

The default segment is 0 so you want to change it to a different value.

After nodes have been added you can check in which segment they are located by looking at the Overview tab:

Deploying Multi-Cloud MariaDB Cluster

Conclusion

We hope this short blog gave you a better understanding of the options you have for multi-cloud MariaDB Cluster deployments and how they can be used to ensure high availability of your database infrastructure.

MariaDB Cluster Offline Installation for CentOS

$
0
0

Most of the installation steps available on the Internet cover the standard online installation, presuming the database hosts are having an active internet connection to the package repositories and satisfy all dependencies. However, installation steps and commands are a bit different for offline installation. Offline installation is a common practice in a strict and secure environment like financial and military sectors for security compliance, reducing the exposure risks and maintaining confidentiality. 

In this blog post, we are going to install a three-node MariaDB Cluster in an offline environment on CentOS hosts. Consider the following three nodes for this installation:

  • mariadb1 - 192.168.0.241
  • mariadb2 - 192.168.0.242
  • mariadb3 - 192.168.0.243

Download Packages

The most time-consuming part is getting all the packages required for our installation. Firstly, go to the respective MariaDB repository that we want to install (in this example, our OS is CentOS 7 64bit):

Make sure you download the exact same minor version for all MariaDB-related packages. In this example, we downloaded MariaDB version 10.4.13. There are a bunch of packages in this repository but we don't need them all just to run a MariaDB Cluster. Some of the packages are outdated and for debugging purposes. For MariaDB Galera 10.4 and CentOS 7, we need to download the following packages from the MariaDB 10.4 repository:

  • jemalloc
  • galera-3/galera-4
  • libzstd
  • MariaDB backup
  • MariaDB server
  • MariaDB client
  • MariaDB shared
  • MariaDB common
  • MariaDB compat

The following wget commands would simplify the download process:

wget http://yum.mariadb.org/10.4/centos7-amd64/rpms/galera-4-26.4.4-1.rhel7.el7.centos.x86_64.rpm
wget http://yum.mariadb.org/10.4/centos7-amd64/rpms/jemalloc-3.6.0-1.el7.x86_64.rpm
wget http://yum.mariadb.org/10.4/centos7-amd64/rpms/libzstd-1.3.4-1.el7.x86_64.rpm
wget http://yum.mariadb.org/10.4/centos7-amd64/rpms/MariaDB-backup-10.4.13-1.el7.centos.x86_64.rpm
wget http://yum.mariadb.org/10.4/centos7-amd64/rpms/MariaDB-client-10.4.13-1.el7.centos.x86_64.rpm
wget http://yum.mariadb.org/10.4/centos7-amd64/rpms/MariaDB-common-10.4.13-1.el7.centos.x86_64.rpm
wget http://yum.mariadb.org/10.4/centos7-amd64/rpms/MariaDB-compat-10.4.13-1.el7.centos.x86_64.rpm
wget http://yum.mariadb.org/10.4/centos7-amd64/rpms/MariaDB-server-10.4.13-1.el7.centos.x86_64.rpm
wget http://yum.mariadb.org/10.4/centos7-amd64/rpms/MariaDB-shared-10.4.13-1.el7.centos.x86_64.rpm

Some of these packages have dependencies to other packages. To satisfy them all, it's probably best to mount the operating system ISO image and point the yum package manager to use the ISO image as an offline base repository instead. Otherwise, we would waste a lot of time trying to download/transfer the packages from one host/media to another.

If you are looking for older MariaDB packages, look them up in its archive repository here. Once downloaded, transfer the packages into all the database servers via USB drive, DVD burner or any network storage connected to the database hosts.

Mount the ISO Image Locally

Some of the dependencies are needed to be satisfied during the installation and one way to achieve this easily is by setting up the offline yum repository on the database servers. Firstly, we have to download the CentOS 7 DVD ISO image from the nearest CentOS mirror site, under "isos" directory:

$ wget http://centos.shinjiru.com/centos/7/isos/x86_64/CentOS-7-x86_64-DVD-2003.iso

You can either transfer the image and mount it directly or burn it into a DVD and use the DVD drive and connect it to the server. In this example, we are going to mount the ISO image as a DVD in the server:

$ mkdir -p /media/CentOS
$ mount -o loop /root/CentOS-7-x86_64-DVD-2003.iso /media/CentOS

Then, enable the CentOS-Media (c7-media) repository and disable the standard online repositories (base,updates,extras):

$ yum-config-manager --disable base,updates,extras
$ yum-config-manager --enable c7-media

We are now ready for the installation.

Installing and Configuring the MariaDB Server

Installation steps are pretty straightforward if we have all the necessary packages ready. Firstly, it's recommended to disable SElinux (or set it to permissive mode):

$ setenforce 0
$ sed -i 's/^SELINUX=.*/SELINUX=permissive/g' /etc/selinux/config

Navigate to the directory where all the packages are located, in this case, /root/installer/. Make sure all the packages are there:

$ cd /root/installer
$ ls -1
galera-4-26.4.4-1.rhel7.el7.centos.x86_64.rpm
jemalloc-3.6.0-1.el7.x86_64.rpm
libzstd-1.3.4-1.el7.x86_64.rpm
MariaDB-backup-10.4.13-1.el7.centos.x86_64.rpm
MariaDB-client-10.4.13-1.el7.centos.x86_64.rpm
MariaDB-common-10.4.13-1.el7.centos.x86_64.rpm
MariaDB-compat-10.4.13-1.el7.centos.x86_64.rpm
MariaDB-server-10.4.13-1.el7.centos.x86_64.rpm
MariaDB-shared-10.4.13-1.el7.centos.x86_64.rpm

Let's install the mariabackup dependency called socat first and then run the yum localinstall command to install the RPM packages and satisfy all dependencies:

$ yum install socat
$ yum localinstall *.rpm

Start the MariaDB service and check the status:

$ systemctl start mariadb
$ systemctl status mariadb

Make sure you see no error in the process. Then, run the mysql_secure_installation script to configure the MySQL root password and hardening:

$ mysql_secure_installation

Make sure the MariaDB root password is identical on all MariaDB hosts. Create a MariaDB user to perform backup and SST. This is important if we want to use the recommended mariabackup as the SST method for MariaDB Cluster, and also for backup purposes:

$ mysql -uroot -p
MariaDB> CREATE USER backup_user@localhost IDENTIFIED BY 'P455w0rd';
MariaDB> GRANT SELECT, INSERT, CREATE, RELOAD, PROCESS, SUPER, LOCK TABLES, REPLICATION CLIENT, SHOW VIEW, EVENT, CREATE TABLESPACE ON *.* TO backup_user@localhost;

We need to modify the default configuration file to load up MariaDB Cluster functionalities. Open /etc/my.cnf.d/server.cnf and make sure the following lines exist for minimal configuration:

[mysqld]
log_error = /var/log/mysqld.log

[galera]
wsrep_on=ON
wsrep_provider=/usr/lib64/galera-4/libgalera_smm.so
wsrep_cluster_address=gcomm://192.168.0.241,192.168.0.242,192.168.0.243
binlog_format=row
default_storage_engine=InnoDB
innodb_autoinc_lock_mode=2
bind-address=0.0.0.0
innodb_flush_log_at_trx_commit=2
wsrep_sst_method=mariabackup
wsrep_sst_auth=backup_user:P455w0rd
wsrep_node_address=192.168.0.241 # change this

Don't forget to change the wsrep_node_address value with the IP address of the database node for MariaDB Cluster communication. Also, the wsrep_provider value might be different depending on the MariaDB server and MariaDB Cluster version that you have installed. Locate the libgalera_smm.so path and specify it accordingly here.

Repeat the same steps on all database nodes and we are now ready to start our cluster.

Bootstrapping the Cluster

Since this is a new cluster, we can pick any of the MariaDB nodes to become the reference node for the cluster bootstrapping process. Let's pick mariadb1. Make sure the MariaDB is stopped first, then run the galera_new_cluster command to bootstrap:

$ systemctl stop mariadb
$ galera_new_cluster
$ systemctl status mariadb

On the other two nodes (mariadb2 and mariadb3), we are going to start it up using standard MariaDB start command:

$ systemctl stop mariadb
$ systemctl start mariadb

Verify if all nodes are part of the cluster by looking at the wsrep-related status on every node:

MariaDB> SHOW STATUS LIKE 'wsrep%';

Make sure the reported status are as the following:

wsrep_local_state_comment     | Synced
wsrep_cluster_size            | 3
wsrep_cluster_status          | Primary

For MariaDB 10.4 and Galera Cluster 4, we can get the cluster member information directly from table mysql.wsrep_cluster_members on any MariaDB node:

$ mysql -uroot -p -e 'select * from mysql.wsrep_cluster_members'
Enter password:
+--------------------------------------+--------------------------------------+---------------+-----------------------+
| node_uuid                            | cluster_uuid                         | node_name     | node_incoming_address |
+--------------------------------------+--------------------------------------+---------------+-----------------------+
| 35177dae-a7f0-11ea-baa4-1e4604dc8f68 | de82efcb-a7a7-11ea-8273-b7a81016a75f | maria1.local  | AUTO                  |
| 3e6f9d0b-a7f0-11ea-a2e9-32f4a0481dd9 | de82efcb-a7a7-11ea-8273-b7a81016a75f | maria2.local  | AUTO                  |
| fd63108a-a7f1-11ea-b100-937c34421a67 | de82efcb-a7a7-11ea-8273-b7a81016a75f | maria3.local  | AUTO                  |
+--------------------------------------+--------------------------------------+---------------+-----------------------+

If something goes wrong during the cluster bootstrapping, check the MySQL error log at /var/log/mysqld.log on all MariaDB nodes. Once a cluster is bootstrapped and running, do not run galera_new_cluster script again to start a MariaDB service. It should be enough by using the standard "systemctl start/restart mariadb" command, unless there is no database node in PRIMARY state anymore. Check out this blog post, How to Bootstrap MySQL or MariaDB Cluster to understand why this step is critical.

Bonus Step

Now you already have a database cluster running without any monitoring and management features. Why don't you import the database cluster into ClusterControl? Install ClusterControl on another separate server, and setup passwordless SSH from the ClusterControl server to all database nodes. Supposed the ClusterControl server IP is 192.168.0.240, run the following commands on ClusterControl server:

$ whoami
root

$ ssh-keygen -t rsa # generate key, press Enter for all prompts
$ ssh-copy-id root@192.168.0.241 # root password on 192.168.0.241
$ ssh-copy-id root@192.168.0.242 # root password on 192.168.0.242
$ ssh-copy-id root@192.168.0.243 # root password on 192.168.0.243

Then go to ClusterControl -> Import -> MySQL Galera and enter the required SSH details:

Import MariaDB Cluster

In the second step under Define MySQL Servers, toggle off "Automatic Node Discovery" and specify all the IP address of the database nodes, and make sure there is a tick green next to the IP address, indicating ClusterControl is able to reach the node via passwordless SSH:

Import MariaDB Cluster

Click Import and wait until the import job completes. You should see it under the cluster list:

Import MariaDB Cluster

You are in good hands now. Note that ClusterControl will default to 30-day full enterprise features and after it expires, it will default back to Community Edition, which is free forever.


Multi-Cloud Deployment for MariaDB Replication Using WireGuard

$
0
0

In this blog post, we are going to look into how to deploy a MariaDB replication setup in a multi-cloud environment. Suppose our primary application is located at AWS, it's the best idea to set up AWS as the primary datacenter hosting the MariaDB master. The MariaDB slave will be hosted on GCP and ClusterControl is located inside the company's private cloud infrastructure in the office. They are all connected via WireGuard simple and secure VPN tunnel in the IP range of 192.168.50.0/24. ClusterControl will use this VPN interface to perform deployment, management and monitoring on all database nodes remotely.

Here are our hosts:

  • Amazon Web Service (AWS):
    • Host: MariaDB master
    • Public IP: 54.151.183.93
    • Private IP: 10.15.3.170/24 (VPC)
    • VPN IP: 192.168.50.101
    • OS: Ubuntu 18.04.4 LTS (Bionic)
    • Spec: t2.medium (2 vCPU, 4 GB memory)
  • Google Cloud Platform (GCP): 
    • Host: MariaDB slave
    • Public IP: 35.247.147.95
    • Private IP: 10.148.0.9/32
    • VPN IP: 192.168.50.102
    • OS: Ubuntu 18.04.4 LTS (Bionic)
    • Spec: n1-standard-1 (1 vCPU, 3.75 GB memory)
  • VMware Private Cloud (Office):
    • Host: ClusterControl
    • Public IP: 3.25.96.229
    • Private IP: 192.168.55.138/24
    • VPN IP: 192.168.50.100
    • OS: Ubuntu 18.04.4 LTS (Bionic)
    • Spec: Private cloud VMWare (2 CPU, 2 GB of RAM)

Our final architecture will be looking something like this:

MariaDB Replication Multicloud

The host mapping under /etc/hosts on all nodes is:

3.25.96.229     cc clustercontrol office.mydomain.com
54.151.183.93   aws1 db1 mariadb1 db1.mydomain.com
35.247.147.95   gcp2 db2 mariadb2 db2.mydomain.com

Setting up host mapping will simplify our name resolving management between hosts, where we will use the hostname instead of IP address when configuring Wireguard peers.

Installing WireGuard for VPN

Since all servers are in three different places, which are only connected via public network, we are going to set up VPN tunneling between all nodes using Wireguard. We will add a new network interface on every node for this communication with the following internal IP configuration:

  • 192.168.50.100 - ClusterControl (Office private cloud)
  • 192.168.50.101 - MariaDB master (AWS)
  • 192.168.50.102 - MariaDB slave (GCP)

Install Wireguard as shown in this page on all three nodes:

$ sudo add-apt-repository ppa:wireguard/wireguard
$ sudo apt-get upgrade
$ sudo apt-get install wireguard

For Ubuntu hosts, just accept the default value if prompted during the wireguard installation. Note that it's very important to upgrade the OS to the latest version for wireguard to work.

Reboot the host to load the Wireguard kernel module:

$ reboot

Once up, configure our host mapping inside /etc/hosts on all nodes to something like this:

$ cat /etc/hosts
3.25.96.229     cc clustercontrol office.mydomain.com
54.151.183.93   aws1 db1 mariadb1 db1.mydomain.com
35.247.147.95   gcp2 db2 mariadb2 db2.mydomain.com
127.0.0.1       localhost

Setting up Wireguard

** All steps under this section should be performed on all nodes, unless specified otherwise.

1) On all nodes as a root user, generate a private key and assign a secure permission

$ umask 077
$ wg genkey > /root/private

2) Then, add a new interface called wg0:

$ ip link add wg0 type wireguard

3) Add the corresponding IP address to wg0 interface:

For host "cc":

$ ip addr add 192.168.50.100/32 dev wg0

For host "aws1":

$ ip addr add 192.168.50.101/32 dev wg0

For host "gcp2":

$ ip addr add 192.168.50.102/32 dev wg0

4) Make the listening port to 55555 and assign the generated private key to the Wireguard interface:

$ wg set wg0 listen-port 55555 private-key /root/private

5) Bring up the network interface:

$ ip link set wg0 up

6) Once the interface is up, verify with the "wg" command:

(cc1)$ wg
interface: wg0
  public key: sC91qhb5QI4FjBZPlwsTLNIlvuQqsALYt5LZomUFEh4=
  private key: (hidden)
  listening port: 55555
(aws1) $ wg
interface: wg0
  public key: ZLdvYjJlaS56jhEBxWGFFGprvZhtgJKwsLVj3zGonXw=
  private key: (hidden)
  listening port: 55555
(gcp2) $wg
interface: wg0
  public key: M6A18XobRFn7y7u6cg8XlEKy5Nf0ZWqNMOw/vVONhUY=
  private key: (hidden)
  listening port: 55555

Now we are ready to connect them all.

Connecting Hosts via Wireguard Interface

Now we are going to add all the nodes as peers and allow them to communicate with each other. The command requires 4 important parameters:

  • peer: Public key for the target host.
  • allowed-ips: IP address of the host that is allowed to communicate with.
  • endpoint: The host and Wireguard and listening port (here we configure all nodes to use port 55555).
  • persistent-keepalive: Because NAT and stateful firewalls keep track of "connections", if a peer behind NAT or a firewall wishes to receive incoming packets, it must keep the NAT/firewall mapping valid, by periodically sending keepalive packets. Default value is 0 (disable).

Therefore, on host cc, we need to add "aws1" and "gcp2":

$ wg set wg0 peer ZLdvYjJlaS56jhEBxWGFFGprvZhtgJKwsLVj3zGonXw= allowed-ips 192.168.50.101/32 endpoint aws1:55555 persistent-keepalive 25
$ wg set wg0 peer M6A18XobRFn7y7u6cg8XlEKy5Nf0ZWqNMOw/vVONhUY= allowed-ips 192.168.50.102/32 endpoint gcp2:55555 persistent-keepalive 25

On host "aws1", we need to add the cc and gcp2:

$ wg set wg0 peer sC91qhb5QI4FjBZPlwsTLNIlvuQqsALYt5LZomUFEh4= allowed-ips 192.168.50.100/32 endpoint cc:55555 persistent-keepalive 25
$ wg set wg0 peer M6A18XobRFn7y7u6cg8XlEKy5Nf0ZWqNMOw/vVONhUY= allowed-ips 192.168.50.102/32 endpoint gcp2:55555 persistent-keepalive 25

On host "gcp2", we need to add the cc and aws1:

$ wg set wg0 peer sC91qhb5QI4FjBZPlwsTLNIlvuQqsALYt5LZomUFEh4= allowed-ips 192.168.50.100/32 endpoint gcp2:55555 persistent-keepalive 25
$ wg set wg0 peer ZLdvYjJlaS56jhEBxWGFFGprvZhtgJKwsLVj3zGonXw= allowed-ips 192.168.50.101/32 endpoint aws1:55555 persistent-keepalive 25

From every host, try to ping each other and make sure you get some replies:

(cc)$ ping 192.168.50.101 # aws1
(cc)$ ping 192.168.50.102 # gcp2
(aws1)$ ping 192.168.50.101 # cc
(aws1)$ ping 192.168.50.102 # gcp2
(gcp2)$ ping 192.168.50.100 # cc
(gcp2)$ ping 192.168.50.101 # aws1

Check the "wg" output to verify the current status. Here is the output of from host cc point-of-view:

interface: wg0
  public key: sC91qhb5QI4FjBZPlwsTLNIlvuQqsALYt5LZomUFEh4=
  private key: (hidden)
  listening port: 55555

peer: M6A18XobRFn7y7u6cg8XlEKy5Nf0ZWqNMOw/vVONhUY=
  endpoint: 35.247.147.95:55555
  allowed ips: 192.168.50.102/32
  latest handshake: 34 seconds ago
  transfer: 4.70 KiB received, 6.62 KiB sent
  persistent keepalive: every 25 seconds

peer: ZLdvYjJlaS56jhEBxWGFFGprvZhtgJKwsLVj3zGonXw=
  endpoint: 54.151.183.93:55555
  allowed ips: 192.168.50.101/32
  latest handshake: 34 seconds ago
  transfer: 3.12 KiB received, 9.05 KiB sent
  persistent keepalive: every 25 seconds

All status looks good. We can see the endpoints, handshake status and bandwidth status between nodes. It's time to make this configuration persistent into a configuration file, so it can be loaded up by WireGuard easily. We are going to store it into a file located at /etc/wireguard/wg0.conf. Firstly, create the file:

$ touch /etc/wireguard/wg0.conf

Then, export the runtime configuration for interface wg0 and save it into wg0.conf using "wg-quick" command:

$ wg-quick save wg0

Verify the configuration file's content (example for host "cc"):

(cc)$ cat /etc/wireguard/wg0.conf
[Interface]
Address = 192.168.50.100/24
ListenPort = 55555
PrivateKey = UHIkdA0ExCEpCOL/iD0AFaACE/9NdHYig6CyKb3i1Xo=

[Peer]
PublicKey = ZLdvYjJlaS56jhEBxWGFFGprvZhtgJKwsLVj3zGonXw=
AllowedIPs = 192.168.50.101/32
Endpoint = 54.151.183.93:55555
PersistentKeepalive = 25

[Peer]
PublicKey = M6A18XobRFn7y7u6cg8XlEKy5Nf0ZWqNMOw/vVONhUY=
AllowedIPs = 192.168.50.102/32
Endpoint = 35.247.147.95:55555
PersistentKeepalive = 25

Command wg-quick provides some cool shortcuts to manage and configure the WireGuard interfaces. Use this tool to bring the network interface up or down:

(cc)$ wg-quick down wg0
[#] ip link delete dev wg0

(cc)$ wg-quick up wg0
[#] ip link add wg0 type wireguard
[#] wg setconf wg0 /dev/fd/63
[#] ip -4 address add 192.168.50.100/24 dev wg0
[#] ip link set mtu 8921 up dev wg0

Finally, we instruct systemd to load this interface right during startup:

$ systemctl enable wg-quick@wg0
Created symlink /etc/systemd/system/multi-user.target.wants/wg-quick@wg0.service → /lib/systemd/system/wg-quick@.service.

At this point, our VPN configuration is complete and we can now start the deployment.

Deploying MariaDB Replication

Once every node in the architecture can talk to each other, it's time to move on with the final step to deploy our MariaDB Replication using ClusterControl.

Install ClusterControl on cc:

(cc)$ wget https://severalnines.com/downloads/cmon/install-cc
(cc)$ chmod 755 install-cc
(cc)$ ./install-cc

Follow the instructions until the installation completes. Next, we need to set up a passwordless SSH from ClusterControl host to both MariaDB nodes. Firstly, generate an SSH key for user root:

(cc)$ whoami
root
(cc)$ ssh-keygen -t rsa # press Enter for all prompts

Copy the public key content at /root/.ssh/id_rsa.pub onto the MariaDB nodes under /root/.ssh/authorized_keys. This presumes that root is allowed to SSH to the host. Otherwise, configure the SSH daemon to allow this accordingly. Verify that passwordless SSH is set up correctly. On ClusterControl node, execute remote SSH command and make sure you will get a correct reply without any password prompt:

(cc)$ ssh 192.168.50.101 "hostname"
aws1
(cc)$ ssh 192.168.50.102 "hostname"
gcp2

We can now deploy our MariaDB replication. Open a web browser and go to ClusterControl UI at http://public_ip_of_CC/clustercontrol, create a super admin user login. Go to Deploy -> MySQL Replication and specify the following:

Deploy MariaDB MultiCloud

Then, choose "MariaDB" as a vendor with version 10.4. Specify the MariaDB root password as well. Under the "Define Topology" section, specify the Wireguard IP address (wg0) of the MariaDB nodes, similar to the following screenshot:

MariaDB Multicloud Deployment

Click Deploy and wait until the deployment is complete. Once done, you should see the following:

MariaDB Replication Cluster Multicloud Deployment

Our MariaDB replication setup is now running on three different locations (office, AWS and GCP), connected with a secure VPN tunneling between nodes.

What’s New in MariaDB Server 10.5?

$
0
0

MariaDB Server 10.5 is a fresh, new, and stable version from MariaDB that was released on June, 24th 2020. Let’s take a look at the features that it will bring us.

More Granular Privileges

With MariaDB 10.5 some changes regarding the privileges are coming. Mainly, SUPER privilege has been split into several new privileges that allows to set more granular control over what actions are allowed for given users and what are not. Below is the list of the new privileges that are available in MariaDB 10.5:

  • BINLOG ADMIN
  • BINLOG REPLAY
  • CONNECTION ADMIN
  • FEDERATED ADMIN
  • READ_ONLY ADMIN
  • REPLICATION MASTER ADMIN
  • REPLICATION SLAVE ADMIN
  • SET USER

InnoDB Performance Improvements

MariaDB 10.5 comes with a list of performance improvements for InnoDB. What is important to know is that MariaDB 10.5 has embedded InnoDB from MariaDB 10.4. There are going to be performance modifications and improvements but the core of InnoDB is the same as in MariaDB 10.4. This is very interesting to see how the path MariaDB has chosen will bring in terms of the performance. On one hand, sticking to the old version allows faster release cycles for MariaDB - porting totally new InnoDB to MariaDB would be quite a challenge and, let’s be honest, may not be really feasible to accomplish. Please keep in mind that MariaDB becomes more and more incompatible with the upstream. It’s been a while since the last build where you could just swap binaries and everything would work without any issues. 

MariaDB developed its set of features like encryption or compression, making those implementations not compatible. On the other hand, new InnoDB has shown significantly better performance than MariaDB 10.4. Lots of lines of code have been written (and lots of lines of code have been removed) to make it more scalable than the previous version. It will be very interesting to see if MariaDB 10.5 will be able to outperform its concurrents.

We will not be getting into details as this is what you can find on MariaDB website, we’d like to mention some of the changes. InnoDB redo logs have seen some work making them more efficient. InnoDB buffer pool has also been improved to the extent that the option to create multiple buffer pools has been removed as no longer needed - performance challenges it was aimed to fix had already been fixed in 10.5 thus making this option not necessary.

What is also important to keep in mind is that InnoDB in 10.5 will be, due to the changes, will be incompatible with InnoDB in 10.4. The upgrade will be one-way only, you should plan your upgrade process accordingly.

Full GTID Support for Galera Cluster

Galera Cluster will come in MariaDB 10.5 with full GTID support. This should make the mixing of Galera Cluster and asynchronous replication more seamless and less problematic.

More Metadata for Replication and Binary Logs

Talking about replication, MariaDB 10.5 has improved binary log metadata. It comes with more information about the data being replicated:

  • Signedness of Numeric Columns
  • Character Set of Character Columns and Binary Columns
  • Column Name
  • String Value of SET Columns
  • String Value of ENUM Columns
  • Primary Key
  • Character Set of SET Columns and ENUM Columns
  • Geometry Type

This should help to avoid replication issues if there are different schemas on master and on the slave.

Syntax

Several changes in SQL syntax have been introduced in MariaDB 10.5. INTERSECT allows us to write a query that will result in rows that are returned by two SELECT statements. In MariaDB 10.5 INTERSECT ALL has been added, which allows to return a result set with duplicate values. Similarly, EXCEPT has been enhanced to allow for EXCEPT ALL.

Couple of changes have been made into the ALTER syntax - you can now rename columns with ALTER TABLE … RENAME COLUMN. It is also possible to rename index using ALTER TABLE … RENAME KEY syntax. What’s quite important, both ALTER TABLE and RENAME TABLE received a support for IF EXISTS, it will definitely help in terms of replication handling.

Performance Schema Updates to Match MySQL 5.7 

Performance Schema tables have been updated so that they will be on par with Performance Schema from MySQL 5.7. This means changes in instrumentation related to memory, metadata locking, prepared statements, stored procedures, locking, transactions and user variables.

Binaries Named mariadb

Last but not least, binaries have been changed from ‘mysql’ to ‘mariadb’. The old naming convention, however, can still be used to keep the compatibility with existing scripts and tools.

On top of that, several other changes have been introduced. JSON array and object aggregation function, improved instrumentation for the connection pool, improvements in the query optimizer or migration to new version of library for regular expressions. Integration with S3 has also been introduced - you can read data from S3 buckets from within MariaDB 10.5.

We are looking forward to seeing how this new MariaDB version will look like in production environments. If you are interested in trying, migration instructions are available on MariaDB website

What is MariaDB ColumnStore?

$
0
0

In general, databases store data in row format and use SQL as query language to access it, but this storage method is not always the best in terms of performance, it depends on the workload itself. If you want to get statistical data, you should most probably use another kind of database storage engine.

In this blog, we will see what Columnar Storage is and, to be more specific, what MariaDB ColumnStore is, and how to install it to be able to process your big data in a more performant way for analytical purposes.

Columnar Storage

Columnar Storage is a type of database engine that stores data using a column-oriented model.

For example, in a common relational database, we could have a table like this:

id

firstname

lastname

age

1001

Oliver

Smith

23

1002

Harry

Jones

65

1003

George

Williams

30

1004

Jack

Taylor

41

This is fine if you want to get, for example, the age of a specific person, where you will need all or almost all the row information, but if you need to get statistics on a specific column (e.g. average age), this is not the best structure.

Here is where a Columnar Storage engine comes into play. Instead of storing data in rows, the data is stored in columns. So, if you need to know the average age, it will be better to use it, as you will have a structure like this:

id

firstname


id

lastname


id

age

1001

Oliver


1001

Smith


1001

23

1002

Harry


1002

Jones


1002

65

1003

George


1003

Williams


1003

30

1004

Jack


1004

Taylor


1004

41

Which means, you only need to read id and age to know the average age instead of all the data.

n the other hand, the cost of doing single inserts is higher than a row-oriented database, and it is not the best option for “SELECT *” queries or transactional operations, so we can say that it fits better in an OLAP (Online Analytical Processing) database than an OLTP (Online Transaction Processing) one.

MariaDB ColumnStore

It is a columnar storage engine that uses a massively parallel distributed data architecture. It is a separate download, but it will be available as a storage engine for MariaDB Server from MariaDB 10.5.4, which is still in development at the time of this blog was written.

It is designed for big data, using the benefits of columnar storage to have a great performance with real-time response to analytical queries.

MariaDB ColumnStore Architecture

It is composed of many (or just 1) MariaDB Servers, operating as modules, working together. These modules include User, Performance, and Storage.

MariaDB ColumnStore

User Module

It is a MariaDB Server instance configured to operate as a front-end to ColumnStore.

The User Module manages and controls the operation of end-user queries. When a client runs a query, it is parsed and distributed to one or more Performance Modules to process the query. The User module then collects the query results and assembles them into the result-set to return to the client.

The primary purpose of the User Module is to handle concurrency scaling. It never directly touches database files and doesn't require visibility to them.

Performance Module

It is responsible for storing, retrieving, and managing data, processing block requests for query operations, and for passing it back to the User module or modules to finalize the query requests. It doesn't see the query itself, but only a set of instructions given to it by a User Module.

The module selects data from disk and caches it in a shared-nothing buffer that is part of the server on which it runs.

Having multiple Performance Module nodes, a heartbeat mechanism ensures that all nodes are online and there is transparent failover in the event that a particular node fails. 

Storage

You can use local storage (Performance Modules), or shared storage (SAN), to store data.

When you create a table on MariaDB ColumnStore, the system creates at least one file per column in the table. So, for instance, a table created with three columns would have a minimum of three, separately addressable logical objects created on a SAN or on the local disk of a Performance Module.

ColumnStore optimizes its compression strategy for read performance from disk. It is tuned to accelerate the decompression rate, maximizing the performance benefits when reading from disk.

MariaDB ColumnStore uses the Version Buffer to store disk blocks that are being modified, manage transaction rollbacks, and service the MVCC (multi-version concurrency control) or "snapshot read" function of the database. This allows it to offer a query consistent view of the database.

How MariaDB CloumnStore Works

Now, let’s see how MariaDB ColumnStore processes an end-user query, according to the official MariaDB ColumnStore documentation:

  • Clients issue a query to the MariaDB Server running on the User Module. The server performs a table operation for all tables needed to fulfill the request and obtains the initial query execution plan.
  • Using the MariaDB storage engine interface, ColumnStore converts the server table object into ColumnStore objects. These objects are then sent to the User Module processes.
  • The User Module converts the MariaDB execution plan and optimizes the given objects into a ColumnStore execution plan. It then determines the steps needed to run the query and the order in which they need to be run.
  • The User Module then consults the Extent Map to determine which Performance Modules to consult for the data it needs, it then performs Extent Elimination, eliminating any Performance Modules from the list that only contain data outside the range of what the query requires.
  • The User Module then sends commands to one or more Performance Modules to perform block I/O operations.
  • The Performance Module or Modules carry out predicate filtering, join processing, initial aggregation of data from local or external storage, then send the data back to the User Module.
  • The User Module performs the final result-set aggregation and composes the result-set for the query.
  • The User Module / ExeMgr implements any window function calculations, as well as any necessary sorting on the result-set. It then returns the result-set to the server.
  • The MariaDB Server performs any select list functions, ORDER BY and LIMIT operations on the result-set.
  • The MariaDB Server returns the result-set to the client.

How to Install MariaDB ColumnStore

Now, let’s see how to install it. For more information, you can check the MariaDB official documentation.

We will use CentOS 7 as the operating system, but you can use any supported OS instead. The installation packages are available for download here.

First, you will need to install the Extra Packages repository:

$ yum install -y epel-release

Then, the following required packages:

$ yum install -y boost expect perl perl-DBI openssl zlib snappy libaio perl-DBD-MySQL net-tools wget jemalloc numactl-libs

And now, let’s download the MariaDB ColumnStore latest version, uncompress, and install it:

$ wget https://downloads.mariadb.com/ColumnStore/latest/centos/x86_64/7/mariadb-columnstore-1.2.5-1-centos7.x86_64.rpm.tar.gz

$ tar zxf mariadb-columnstore-1.2.5-1-centos7.x86_64.rpm.tar.gz

$ rpm -ivh mariadb-columnstore-1.2.5-1-*.rpm

When it is finished, you will see the following message:

The next step is:

If installing on a pm1 node using non-distributed install

/usr/local/mariadb/columnstore/bin/postConfigure


If installing on a pm1 node using distributed install

/usr/local/mariadb/columnstore/bin/postConfigure -d


If installing on a non-pm1 using the non-distributed option:

/usr/local/mariadb/columnstore/bin/columnstore start

So, for this example, let’s just run the command:

$ /usr/local/mariadb/columnstore/bin/postConfigure

Now, it will ask you some information about the installation:

This is the MariaDB ColumnStore System Configuration and Installation tool.

It will Configure the MariaDB ColumnStore System and will perform a Package

Installation of all of the Servers within the System that is being configured.


IMPORTANT: This tool requires to run on the Performance Module #1


Prompting instructions:

Press 'enter' to accept a value in (), if available or

Enter one of the options within [], if available, or

Enter a new value


===== Setup System Server Type Configuration =====


There are 2 options when configuring the System Server Type: single and multi

  'single'  - Single-Server install is used when there will only be 1 server configured

              on the system. It can also be used for production systems, if the plan is

              to stay single-server.

  'multi'   - Multi-Server install is used when you want to configure multiple servers now or

              in the future. With Multi-Server install, you can still configure just 1 server

              now and add on addition servers/modules in the future.


Select the type of System Server install [1=single, 2=multi] (2) > 1

Performing the Single Server Install.


Enter System Name (columnstore-1) >


===== Setup Storage Configuration =====


----- Setup Performance Module DBRoot Data Storage Mount Configuration -----

There are 2 options when configuring the storage: internal or external

  'internal' -    This is specified when a local disk is used for the DBRoot storage.

                  High Availability Server Failover is not Supported in this mode

  'external' -    This is specified when the DBRoot directories are mounted.

                  High Availability Server Failover is Supported in this mode.


Select the type of Data Storage [1=internal, 2=external] (1) >

Enter the list (Nx,Ny,Nz) or range (Nx-Nz) of DBRoot IDs assigned to module 'pm1' (1) >


===== Performing Configuration Setup and MariaDB ColumnStore Startup =====


NOTE: Setting 'NumBlocksPct' to 50%

      Setting 'TotalUmMemory' to 25% of total memory.


Running the MariaDB ColumnStore setup scripts


post-mysqld-install Successfully Completed

post-mysql-install Successfully Completed

Starting MariaDB Columnstore Database Platform

Starting MariaDB ColumnStore Database Platform Starting, please wait ....... DONE

System Catalog Successfull Created

MariaDB ColumnStore Install Successfully Completed, System is Active

Enter the following command to define MariaDB ColumnStore Alias Commands


. /etc/profile.d/columnstoreAlias.sh


Enter 'mcsmysql' to access the MariaDB ColumnStore SQL console

Enter 'mcsadmin' to access the MariaDB ColumnStore Admin console


NOTE: The MariaDB ColumnStore Alias Commands are in /etc/profile.d/columnstoreAlias.sh

Run the generated script:

$ . /etc/profile.d/columnstoreAlias.sh

Now you can access the database running the “mcsmysql” command:

$ mcsmysql

Welcome to the MariaDB monitor.  Commands end with ; or \g.

Your MariaDB connection id is 12

Server version: 10.3.16-MariaDB-log Columnstore 1.2.5-1


Copyright (c) 2000, 2018, Oracle, MariaDB Corporation Ab and others.


Type 'help;' or '\h' for help. Type '\c' to clear the current input statement.


MariaDB [(none)]>

That’s it. Now, you can load data in your MariaDB ColumnStore database.

Conclusion

Columnar Storage is a great database storage alternative to handle data for analytics purposes. MariaDB ColumnStore is a Columnar Storage engine designed for this task, and as we could see, the installation is pretty easy, so if you need an OLAP database or process big data, you should give it a try.


An Overview of the New DBaaS from MariaDB - SkySQL

$
0
0

MariaDB has recently launched its new DBaaS offering, SkySQL. It might be a surprise to some, but this has been an anticipated move from MariaDB as they have been actively pushing state of the art products for enterprise services over the last few years and have been actively competing with the large market vendors.

Prior to the SkySQL launch,  MariaDB has been working on containers and Helm Charts as far back as 2018. SkySQL offers database availability to multiple regions when setting up and launching your database instance.

What is MariaDB SkySQL?

MariaDB SkySQL is a DBaaS offering which means it's a fully-managed database service and is managed over a cloud service using the Google Cloud Platform (GCP). Take note that the database offered by MariaDB is not the community edition. In fact, it is the MariaDB Enterprise Server alongside MariaDB ColumnStore (or both). 

The benefits of using this offering vs Amazon RDS or Microsoft Azure Database's MariaDB services offerings are versioning (SkySQL ensures users are on the most recent product release) as well as having analytics and transactional support. 

Integrated with its DBaaS is a configuration manager, monitoring with real-time metrics and graphs, and a workload analysis which showcases its machine learning service that identifies changes in workload patterns for proactive resource scaling and service consistency. It is an enticing product for the more avid users of MariaDB enterprise products to use MariaDB SkySQL.

Features of MariaDB SkySQL

MariaDB SkySQL boasts its full power of MariaDB Platform combining different types of their database types from transactions (common setup for OLTP), analytics or data warehousing (OLAP), or if requires a hybrid setup (combination of transactional and analytical database). The following below provides you the straightforward definition of these featured database services platforms:

Transactions

Optimized for fast transaction processing on persistent block storage – with read/write splitting and automatic failover configured and enabled out of the box for transparent load balancing and high availability.

Analytics

Optimized to run ad hoc queries on billions of rows without indexes, combining columnar data on low-cost object storage with multi-threaded query processing – perfect for cloud data warehousing/analytics.

Hybrid or Both

Optimized for smart transaction processing in the cloud, storing data both as rows on persistent block storage and as columns on object storage – create modern applications by enriching transactions with real-time analytics.

The MariaDB SkySQL is also equipped boasting their world-class support which is included in the pricing (standard support) once you register and launch a database instance. There are other options also you can consider if you are on an enterprise level setup. You can opt-in for enterprise and platinum type of support. See more details in their pricing page.

Apart from these features, they also provide monitoring features for checking the status and general health of your database services. Although as of this writing, it is currently in Technical Preview, yet you can already use the service and gather metrics for more granular and real-time checks of your database instance.

The Availability Stack

This SkySQL platform is architectured with service reliability to achieve world class service delivery to the customers and consumers. Regardless how stable the platform is, it has to always fail so as to determine the resiliency of the product and how fast it can be available in case an outage happens and also reduce the RPO (Recovery Point Objective).

For infrastructure, they use the Google Cloud Platform (GCP) and services rely heavily on Google Kubernetes Engine (GKE), a component of the GCP. This means alot for the platform itself since the services of MariaDB SkySQL run in containers powered by Kubernetes. It has the ability to offer resiliency of regional GKE clusters which includes multiple availability zones within a region. It acquires the auto-healing functionality from Kubernetes and also GCP's high SLA escalation at 99.5% uptime.

While it relies on GKE, this means it inherits the nature of Kubernetes from being able to restart the failed containers, fencing an unhealthy container which is automatically killed if detected as failed. Also dead containers are automatically replaced and happen in the background which is left unnoticeable by the naked eye in the customer's perspective.

Multi-Zones are implemented for a Primary/Replica setup which is a Transactions service database setup. It provisions replication primaries in a separate zone within a region from replication replicas. 

MaxScale plays on top for transactional type environments (primary/replica) such as OLTP or the Transactions service while it handles the auto-failover -- covers Transactions and Hybrid services. MaxScale monitors and checks the status of primaries and replicas. If it fails, MaxScale does the job to promote the most updated replica and make it as the new primary. The rest of replicas are then updated pointing to the new primary. Both Transactions and Hybrid service covers self-healing for MaxScale instances. Which means that if a MaxScale instance fails, it is restarted or replaced depending on the state of the issue.

All types of MariaDB SkySQL services do self-healing so it's always highly available for use. This means that if a specific instance fails, whether it's a MariaDB Enterprise Server or a MaxScale instance or a Kubernetes instance, it always adapts the resiliency that Kubernetes does.

Using MariaDB SkySQL

All you have to do is to register through their SkySQL main page. If you have an account, then you can login. It requires that you have to place your payment methods such as Credit/Debit card but you might contact them for more information on this.

Upon launching a service, there are three options you can choose from. See below:

MariaDB SkySQL

I've tested the platform and setup a Transactions service. This means that I have already set up a billing or payment method prior to this action.

While setting up, you are able to select which region you want to deploy your service. Also it has an overview of cost on which type of instance you are going to select. See below:

MariaDB SkySQL

and specify the number of replicas and its transaction storage size, then lastly the service name just like below:

MariaDB SkySQL

Since it runs within the cloud using GCP, it is essentially using the resources such as block storage and its performance that are available from Google Cloud.

Launching your database services might take some time before it can be available for use. In the end it took me ~10 minutes, so you might have to take your coffee break first and get back once it's ready for production use. Once up, this is what it looks like in your Dashboard:

MariaDB SkySQL

Clicking your newly launched service shows you more options to manage your database. It's roughly simple and very straightforward, nothing fancy UI's.

MariaDB SkySQL

All you need to do is specify the types of IP addresses that are required to access or interface the database server. Clicking the Show Credentials button will provide you information about your username, password, download your certificate authority chain, and provides you to connect and change the password.

MariaDB SkySQL

By the way, the information above is already scrap and deleted so exposing it imposes no security concerns.

Basically, I'm able to test this and have already provided the IP address that has to be whitelisted. So connecting via client shows you are more secure connection which channels over TLS/SSL layer:

[vagrant@ansnode1 ~]$ mysql --host sky0001841.mdb0001721.db.skysql.net --port 5001 --user DB00002448 -p --ssl-ca ~/skysql_chain.pem

Enter password:

Welcome to the MySQL monitor.  Commands end with ; or \g.

Your MySQL connection id is 32

Server version: 5.5.5-10.4.12-6-MariaDB-enterprise-log MariaDB Enterprise Server


Copyright (c) 2009-2020 Percona LLC and/or its affiliates

Copyright (c) 2000, 2020, Oracle and/or its affiliates. All rights reserved.


Oracle is a registered trademark of Oracle Corporation and/or its

affiliates. Other names may be trademarks of their respective

owners.


Type 'help;' or '\h' for help. Type '\c' to clear the current input statement.


mysql> select @@hostname;

+-------------------+

| @@hostname        |

+-------------------+

| paultest-mdb-ms-0 |

+-------------------+

1 row in set (0.25 sec)


mysql> show schemas;

+--------------------+

| Database           |

+--------------------+

| information_schema |

| mysql              |

| performance_schema |

+--------------------+

3 rows in set (0.25 sec)


mysql> \s

--------------

mysql  Ver 14.14 Distrib 5.6.48-88.0, for Linux (x86_64) using  6.2


Connection id: 32

Current database:

Current user: DB00002448@10.100.0.162

SSL: Cipher in use is ECDHE-RSA-AES128-GCM-SHA256

Current pager: stdout

Using outfile: ''

Using delimiter: ;

Server version: 5.5.5-10.4.12-6-MariaDB-enterprise-log MariaDB Enterprise Server

Protocol version: 10

Connection: sky0001841.mdb0001721.db.skysql.net via TCP/IP

Server characterset: utf8mb4

Db     characterset: utf8mb4

Client characterset: utf8

Conn.  characterset: utf8

TCP port: 5001

Uptime: 10 min 17 sec


Threads: 12  Questions: 2108  Slow queries: 715  Opens: 26  Flush tables: 1  Open tables: 20  Queries per second avg: 3.416

--------------

The Configuration Manager

MariaDB SkySQL also equipped with a configuration manager that allows you to apply changes, versioned your own configuration updates, or clone an existing configuration, then apply it to a number of services you have in your MariaDB SkySQL account. It somehow share some approach of handling configuration with our Configuration Files Management For example,

[vagrant@ansnode1 ~]$ mysql --host sky0001841.mdb0001721.db.skysql.net --port 5001 --user DB00002448 -p --ssl-ca ~/skysql_chain.pem  Enter password:  Welcome to the MySQL monitor.  Commands end with ; or \g.  Your MySQL connection id is 32  Server version: 5.5.5-10.4.12-6-MariaDB-enterprise-log MariaDB Enterprise Server    Copyright (c) 2009-2020 Percona LLC and/or its affiliates  Copyright (c) 2000, 2020, Oracle and/or its affiliates. All rights reserved.    Oracle is a registered trademark of Oracle Corporation and/or its  affiliates. Other names may be trademarks of their respective  owners.    Type 'help;' or '\h' for help. Type '\c' to clear the current input statement.    mysql> select @@hostname;  +-------------------+  | @@hostname        |  +-------------------+  | paultest-mdb-ms-0 |  +-------------------+  1 row in set (0.25 sec)    mysql> show schemas;  +--------------------+  | Database           |  +--------------------+  | information_schema |  | mysql              |  | performance_schema |  +--------------------+  3 rows in set (0.25 sec)    mysql> \s  --------------  mysql  Ver 14.14 Distrib 5.6.48-88.0, for Linux (x86_64) using  6.2    Connection id: 32  Current database:  Current user: DB00002448@10.100.0.162  SSL: Cipher in use is ECDHE-RSA-AES128-GCM-SHA256  Current pager: stdout  Using outfile: ''  Using delimiter: ;  Server version: 5.5.5-10.4.12-6-MariaDB-enterprise-log MariaDB Enterprise Server  Protocol version: 10  Connection: sky0001841.mdb0001721.db.skysql.net via TCP/IP  Server characterset: utf8mb4  Db     characterset: utf8mb4  Client characterset: utf8  Conn.  characterset: utf8  TCP port: 5001  Uptime: 10 min 17 sec    Threads: 12  Questions: 2108  Slow queries: 715  Opens: 26  Flush tables: 1  Open tables: 20  Queries per second avg: 3.416  --------------

and offers you the following actions you can do with it,

[vagrant@ansnode1 ~]$ mysql --host sky0001841.mdb0001721.db.skysql.net --port 5001 --user DB00002448 -p --ssl-ca ~/skysql_chain.pem  Enter password:  Welcome to the MySQL monitor.  Commands end with ; or \g.  Your MySQL connection id is 32  Server version: 5.5.5-10.4.12-6-MariaDB-enterprise-log MariaDB Enterprise Server    Copyright (c) 2009-2020 Percona LLC and/or its affiliates  Copyright (c) 2000, 2020, Oracle and/or its affiliates. All rights reserved.    Oracle is a registered trademark of Oracle Corporation and/or its  affiliates. Other names may be trademarks of their respective  owners.    Type 'help;' or '\h' for help. Type '\c' to clear the current input statement.    mysql> select @@hostname;  +-------------------+  | @@hostname        |  +-------------------+  | paultest-mdb-ms-0 |  +-------------------+  1 row in set (0.25 sec)    mysql> show schemas;  +--------------------+  | Database           |  +--------------------+  | information_schema |  | mysql              |  | performance_schema |  +--------------------+  3 rows in set (0.25 sec)    mysql> \s  --------------  mysql  Ver 14.14 Distrib 5.6.48-88.0, for Linux (x86_64) using  6.2    Connection id: 32  Current database:  Current user: DB00002448@10.100.0.162  SSL: Cipher in use is ECDHE-RSA-AES128-GCM-SHA256  Current pager: stdout  Using outfile: ''  Using delimiter: ;  Server version: 5.5.5-10.4.12-6-MariaDB-enterprise-log MariaDB Enterprise Server  Protocol version: 10  Connection: sky0001841.mdb0001721.db.skysql.net via TCP/IP  Server characterset: utf8mb4  Db     characterset: utf8mb4  Client characterset: utf8  Conn.  characterset: utf8  TCP port: 5001  Uptime: 10 min 17 sec    Threads: 12  Questions: 2108  Slow queries: 715  Opens: 26  Flush tables: 1  Open tables: 20  Queries per second avg: 3.416  --------------

Previous versions of your configuration are still viewable which adds more convenient when managing your database and configuration changes management.

Workload Analysis and Monitoring

As of this writing, both of these features which are Workload Analysis and Monitoring are currently on Tech Preview. However, the Workload Analysis is not yet ready for use but Monitoring already shows the data collected from your database instances. An example of this is shown below,

MariaDB SkySQL Monitoring

It actually uses Grafana for displaying the metrics and graphs. It offers other views to look upon which you can investigate the health of your database, queries, lags, and system. See below,

MariaDB SkySQL Monitoring

You can check for a Workload Analysis here to feel how it works.

Conclusion

While the MariaDB SkySQL is an entirely new service, you can expect improvements with this service to be coming quick. This is a great move from MariaDB, as users aren't just limited to its community available platforms, but can now use the enterprise level at a reasonable price

How to Deploy a MariaDB Cluster for High Availability

$
0
0

MariaDB Cluster is a Multi Master replication system built from MariaDB Server, MySQL wsrep patch and Galera wsrep provider.  

Galera is based on synchronous (or ‘virtually synchronous’) replication method, which ensures the data applied to other nodes before it is committed. Having the same data on all nodes means that node failures can be easily tolerated, and no data is lost. It is also easier to failover to another node, since all the nodes are up to date with the same data. It is fair to say that MariaDB Cluster is a high availability solution that can achieve high uptime for organizations with strict database Service Level Agreements.

Besides managing high availability, it also can be used to scale the database service and expand the service to multi regions.

MariaDB Cluster Deployment

MariaDB Cluster in ClusterControl is really straightforward, and available in the free to use Community Edition. You can go through “Deploy”, choose MySQL Galera as shown below:

MariaDB Cluster Deployment

Fill in SSH user and credential information, Cluster Name that you want to use and then Continue.

MariaDB Cluster Deployment

Choose MariaDB as the Vendor of the database you want to install. Server Data Directory, Server Port can use the default configuration, unless you define specific configuration. Fill the Admin/Root database password and finally Add Node to add the target IP Addresses of database nodes. 

Galera Nodes require at least 3 nodes or you can use 2 database nodes and galera arbiter configured on a separate host.

After all fields are filled in, just Deploy the cluster. It will trigger a new job to Create Cluster as shown below:

MariaDB Cluster Deployment

Maxscale Deployment

Maxscale is a database load balancer, database proxy, and firewall that sits between your application and the MariaDB nodes. Some of Maxscale features are :

  • Automatic Failover for High Availability
  • Traffic load balancing (read and write split)
  • Traffic controls for queries and connections.

There are two ways to go through Load Balancer Deployment, you can “Add Load Balancer” in Cluster Menu as shown below:

MariaDB Cluster Deployment

Or you can go to Manage -> Load Balancer. It will go to the same page, which is the Load Balancer page. Choose the “Maxscale tab” for deployment of the Maxscale load balancer:

MariaDB Cluster Deployment

Choose the Server Address, define maxscale username and password, you can leave the default configuration for Threads and Read/Write port. Also include the MariaDB node(s) to be added in the load balancer. You can “Deploy MaxScale” for deploying MaxScale database proxy and load balancing.

The best practice to make the load balancer highly available is to set up at least 2 MaxScale instances on different hosts.

Keepalived Deployment

Keepalived is a daemon service in linux used for health checks, and also used for failover if one of the servers is down. The mechanism is using VIP (Virtual IP Address) to achieve high availability, consisting of one server acting as Master, and the other acting as Backup. 

Deployment of Keepalived is service can be done at Manage -> Load Balancer.

MariaDB Cluster Deployment

Please choose your Load Balancer type, which is MaxScale. Currently, ClusterControl supports HAProxy, ProxySQL, and MaxScale as load balancers which can be integrated with Keepalived. Define your Virtual IP (VIP) and Network Interface for Virtual IP Address.

After that, just click Deploy Keepalived. It will trigger a new job to deploy Keepalived on both MaxScale hosts.

MariaDB Cluster Deployment

The final architecture for MariaDB Cluster for High Availability consists of 3 database nodes, 2 load balancer node, and a keepalived service on top of each load balancer as shown on the Topology below :

MariaDB Cluster Deployment - Topology View

Conclusion

We have shown how we can quickly deploy a High Availability MariaDB Cluster with MaxScale and Keepalived via ClusterControl. We went through the setups for database nodes and proxy nodes. To read more about Galera Cluster, do check out our online tutorial. Note that ClusterControl also supports other load balancers like ProxySQL and HAProxy. Do give these a try and let us know if you have any questions.

What Are MariaDB Temporal Tables?

$
0
0

Starting from 10.3.4, MariaDB comes with temporal tables. It is still quite an uncommon feature and we would like to discuss a bit what those tables are and what they can be useful for.

First of all, in case someone has misread the title of this blog, we are talking here about temporal tables, not temporary tables, which as well exist in MariaDB. They do have something in common, though. Time. Temporary tables are short-lived, temporal tables on the other hand are designed to give access to the data over time. In short, you can see temporal tables as a versioned table that can be used to access and modify past data, find what changes have been made and when. It can also be used to rollback data to a particular point in time.

How to Use Temporal Tables in MariaDB

To create a temporal table we only have to add “WITH SYSTEM VERSIONING” to the CREATE TABLE command. If you want to convert regular table into a temporal one, you can run:

ALTER TABLE mytable ADD SYSTEM VERSIONING;

This is pretty much all. A temporal table will be created and you can start querying its data. There are a couple of ways to do that.

First, we can use SELECT to query data as of particular time:

SELECT * FROM mytable FOR SYSTEM_TIME AS OF TIMESTAMP ‘2020-06-26 10:00:00’;

You can also do a query for a range:

SELECT * FROM mytable FOR SYSTEM_TIME FROM ‘2020-06-26 08:00:00’ TO ‘2020-06-26 10:00:00’;

It is also possible to show all data:

SELECT * FROM mytable FOR SYSTEM_TIME ALL;

If needed, you can create views from temporal tables, following the same pattern as we have shown above.

Given that the same rows may not be updated on all of the nodes at the same time (for example, delays caused by replication), if you want to see exactly the same state of the data across the multiple slaves, you can define the point of time using InnoDB transaction id:

SELECT * FROM mytable FOR SYSTEM_TIME AS OF TRANSACTION 123;

By default all data is stored in the same table, both current and old versions of the rows. This may add some overhead when you query only the recent data. It is possible to use partitions to reduce this overhead by creating one or more partitions to store historical data and one to store recent versions of the rows. Then, using partition pruning, MariaDB will be able to reduce the amount of data it has to query to come up with the result for the query:

CREATE TABLE mytable (a INT) WITH SYSTEM VERSIONING

  PARTITION BY SYSTEM_TIME INTERVAL 1 WEEK (

    PARTITION p0 HISTORY,

    PARTITION p1 HISTORY,

    PARTITION p2 HISTORY,

    PARTITION pcur CURRENT

  );

You can also use other means of partitioning it like, for example, defining the number of rows to store per partition.

When using partitioning, we can now apply regular partitioning best practices like data rotation by removing old partitions. If you did not create partitions, you can still do that through commands like:

DELETE HISTORY FROM mytable;

DELETE HISTORY FROM mytable BEFORE SYSTEM_TIME '2020-06-01 00:00:00';

If needed, you can exclude some of the columns from the versioning:

CREATE TABLE mytable (

   a INT,

   b INT WITHOUT SYSTEM VERSIONING

) WITH SYSTEM VERSIONING;

In MariaDB 10.4 a new option has been added, application-time periods. What it means is, basically, that instead of system time it is possible to create versioning based on two columns (time-based) in the table:

CREATE TABLE mytable (

   a INT, 

   date1 DATE,

   date2 DATE,

   PERIOD FOR date_period(date1, date2));

It is also possible to update or delete rows based on the time (UPDATE FOR PORTION and DELETE FOR PORTION). It is also possible to mix application-time and system-time versioning in one table.

Examples of Temporal Tables in MariaDB

Ok, we have discussed the possibilities, let’s take a look at some of things we can do with temporal tables.

At first, let’s create a table and populate it with some data:

MariaDB [(none)]> CREATE DATABASE versioned;

Query OK, 1 row affected (0.000 sec)

MariaDB [(none)]> use versioned

Database changed

MariaDB [versioned]> CREATE TABLE mytable (a INT, b INT) WITH SYSTEM VERSIONING;

Query OK, 0 rows affected (0.005 sec)


MariaDB [versioned]> INSERT INTO mytable VALUES (1,1);

Query OK, 1 row affected (0.001 sec)

MariaDB [versioned]> INSERT INTO mytable VALUES (2,1);

Query OK, 1 row affected (0.001 sec)

MariaDB [versioned]> INSERT INTO mytable VALUES (3,1);

Query OK, 1 row affected (0.000 sec)

Now, let’s update couple of rows:

MariaDB [versioned]> UPDATE mytable SET b = 2 WHERE a < 3;

Query OK, 2 rows affected (0.001 sec)

Rows matched: 2  Changed: 2  Inserted: 2  Warnings: 0

Now, let’s see all the rows that are stored in the table:

MariaDB [versioned]> SELECT * FROM mytable FOR SYSTEM_TIME ALL ;

+------+------+

| a    | b    |

+------+------+

|    1 |    2 |

|    2 |    2 |

|    3 |    1 |

|    1 |    1 |

|    2 |    1 |

+------+------+

5 rows in set (0.000 sec)

As you can see, the table contains not only current versions of the rows but also original values, from before we updated them.

Now, let’s check what the time is and then add some more rows. We’ll see if we can see the current and the past versions.

MariaDB [versioned]> SELECT NOW();

+---------------------+

| NOW()               |

+---------------------+

| 2020-06-26 11:24:55 |

+---------------------+

1 row in set (0.000 sec)

MariaDB [versioned]> INSERT INTO mytable VALUES (4,1);

Query OK, 1 row affected (0.001 sec)

MariaDB [versioned]> INSERT INTO mytable VALUES (5,1);

Query OK, 1 row affected (0.000 sec)

MariaDB [versioned]> UPDATE mytable SET b = 3 WHERE a < 2;

Query OK, 1 row affected (0.001 sec)

Rows matched: 1  Changed: 1  Inserted: 1  Warnings: 0;

Now, let’s check the contents of the table. Only current versions of the rows:

MariaDB [versioned]> SELECT * FROM mytable;

+------+------+

| a    | b    |

+------+------+

|    1 |    3 |

|    2 |    2 |

|    3 |    1 |

|    4 |    1 |

|    5 |    1 |

+------+------+

5 rows in set (0.000 sec)

Then, let’s access the state of the table before we made the inserts and updates:

MariaDB [versioned]> SELECT * FROM mytable FOR SYSTEM_TIME AS OF TIMESTAMP '2020-06-26 11:24:55';

+------+------+

| a    | b    |

+------+------+

|    2 |    2 |

|    3 |    1 |

|    1 |    2 |

+------+------+

3 rows in set (0.000 sec)

Works as expected, we only see three rows in the table.

This short example is by no means extensive. We wanted to give you some idea how you can operate the temporal tables. Applications of this are numerous. Better tracking the state of the order in e-commerce, versioning the contents (configuration files, documents), insight into the past data for analytical purposes.

To make it clear, this feature can be implemented using “traditional” tables, as long as you keep inserting rows, not updating them, but the management is way easier to do when using temporal tables.


Using the Aria Storage Engine with MariaDB Server

$
0
0

MariaDB Server is one of the most popular open-source database servers. It was created by the original developers of MySQL and it became popular for being fast, scalable, and robust. MariaDB has a rich ecosystem of storage engines, plugins, and other available tools that make it very versatile for a wide variety of use cases.

As for the MariaDB storage engine, you have different types to choose from such as XtraDB, InnoDB, MyRocks, MyISAM, or even Aria. There is not a best storage engine type, because it depends on the workload itself. The last one mentioned, Aria Storage Engine, is compiled by default from MariaDB 5.1 and it is required to be 'in use' when the MariaDB service is started.

In this blog, we will see what Aria Storage Engine is, and how to use it in a MariaDB Server.

What is Aria Storage?

Aria is a storage engine for MySQL and MariaDB. It was originally developed with the goal of becoming the default transactional and non-transactional storage engine for MariaDB and MySQL.

Currently, it supports encryption and deadlock detection, and it also offers a crash-safe alternative to MyISAM. When MariaDB restarts after a crash, Aria recovers all tables to the state as of the start of a statement or at the start of the last LOCK TABLES statement.

Aria supports external and internal check, repair, and compression of rows, different row formats, different index compress formats, aria_chk, and more. 

This storage engine has been used for the MariaDB system tables since the 10.4 version.

Differences Between Aria and MyISAM

Let’s see some basic differences between Aria and his direct competitor: MyISAM, and then the advantages and disadvantages of the Aria Storage Engine.

  • Aria uses big log files (1G by default).
  • Aria has a log control file (aria_log_control) and log files (aria_log.%). The log files can be automatically purged when not needed or purged on demand.
  • Aria uses 8K pages by default, while MyISAM uses 1K. This makes Aria a bit faster when using keys of fixed size, but slower when using variable-length packed keys.

Advantages of Aria Storage Engine

  • Data and indexes are crash-safe.
  • On a crash, changes will be rolled back to the state of the start of a statement or a last LOCK TABLES statement.
  • Aria can replay almost everything from the log. The things that can't be replayed yet are:
    • Batch INSERT into an empty table.
    • ALTER TABLEs.
  • LOAD INDEX can skip index blocks for unwanted indexes.
  • Supports all MyISAM ROW formats and new PAGE format where data is stored in pages. 
  • Multiple concurrent inserters into the same table.
  • When using PAGE format, row data is cached by page cache.
  • Aria has unit tests of most parts.
  • Supports both crash-safe and not transactional tables.
  • PAGE is the only crash-safe/transactional row format.
  • PAGE format should give a notable speed improvement on systems that have bad data caching.
  • From MariaDB 10.5, the max key length is 2000 bytes, compared to 1000 bytes in MyISAM.

Disadvantages of Aria Storage Engine

  • Aria doesn't support INSERT DELAYED.
  • Aria doesn't support multiple key caches.
  • The storage of very small rows (< 25 bytes) is not efficient for PAGE format.
  • MERGE tables don't support Aria.
  • Aria data pages in block format have an overhead of 10 bytes/page and 5 bytes/row. Transaction and multiple concurrent-writer support will use an extra overhead of 7 bytes for new rows, 14 bytes for deleted rows, and 0 bytes for old compacted rows.
  • No external locking.
  • Aria has one page size for both index and data. MyISAM supports different page sizes per index.
  • Small overhead per index page (15 bytes).
  • The minimum data file size for PAGE format is 16K.
  • Aria doesn't support indexes on virtual fields.

The Aria Storage Formats

It supports three different table storage formats.

Fixed-length

These tables contain records of a fixed-length. Each column is the same length for all records, regardless of the actual contents. It is the default format if a table has no BLOB, TEXT, VARCHAR or VARBINARY fields, and no ROW FORMAT is provided.

Characteristics:

  • Fast, since MariaDB will always know where a record begins.
  • Easy to cache.
  • Take up more space than dynamic tables, as the maximum amount of storage space will be allocated to each record.
  • Reconstructing after a crash is uncomplicated due to the fixed positions.
  • No fragmentation or need to re-organize, unless records have been deleted and you want to free the space up.

Tables containing BLOB or TEXT fields cannot be FIXED as, by design, these are both dynamic fields.

Dynamic

These tables contain records of a variable length. It is the default format if a table has any BLOB, TEXT, VARCHAR, or VARBINARY fields, and no ROW FORMAT is provided.

Characteristics:

  • Each row contains a header indicating the length of the row.
  • Rows tend to become fragmented easily. UPDATING a record to be longer will likely ensure it is stored in different places on the disk.
  • All string columns with a length of four or more are dynamic.
  • They require much less space than fixed-length tables.
  • Restoring after a crash is more complicated than with FIXED tables.

Page

It is the default format for Aria tables, and is the only format that can be used if TRANSACTIONAL is set to 1.

Characteristics:

  • It is cached by the page cache, which gives a better random performance as it uses fewer system calls.
  • It doesn’t fragment as easily as the DYNAMIC format during UPDATES. The maximum number of fragments is very low.
  • Updates more quickly than dynamic tables.
  • Has a slight storage overhead, mainly notable on very small rows.
  • Slower to perform a full table scan.
  • Slower if there are multiple duplicate keys, as Aria will first write a row, then keys, and only then check for duplicates.

To know the storage format used by a table you can use the SHOW TABLE STATUS statement.

Transactional Options for Aria Storage Engine

Actually, for Aria, transactional means crash-safe, and it is not supported for partitioned tables. It also requires the PAGE row format to make it work.

The TRANSACTIONAL and ROW_FORMAT table options interact as follows:

  • If TRANSACTIONAL=1 is set, then the only supported row format is PAGE. If ROW_FORMAT is set to some other value, then Aria issues a warning, but still forces the row format to be PAGE.
  • If TRANSACTIONAL=0 is set, then the table will not be crash-safe, and any row format is supported.
  • If TRANSACTIONAL is not set to any value, then any row format is supported. If ROW_FORMAT is set, then the table will use that row format. Otherwise, the table will use the default PAGE row format. In this case, if the table uses the PAGE row format, then it will be crash-safe. If it uses some other row format, then it will not be crash-safe.

How to Use the Aria Storage Engine on MariaDB Server

First, you need to create a database (if you don’t have one created), and use it:

MariaDB [(none)]> create database db1;

Query OK, 1 row affected (0.003 sec)

MariaDB [(none)]> use db1

Database changed

Then, create a table using the “Aria” engine:

MariaDB [db1]> CREATE TABLE table1 (id int(11) DEFAULT NULL, name text)

    -> ENGINE=Aria

    -> TRANSACTIONAL=1;

Query OK, 0 rows affected (0.025 sec)

We specified the TRANSACTIONAL value in 1 to see it here, but, as we mentioned, is not necessary as it will be 1 by default if we are using Aria without specifying Row Format and Transactional values. Now, you will have the table created:

MariaDB [db1]> SHOW CREATE TABLE table1\G

*************************** 1. row ***************************

       Table: table1

Create Table: CREATE TABLE `table1` (

  `id` int(11) DEFAULT NULL,

  `name` text DEFAULT NULL

) ENGINE=Aria DEFAULT CHARSET=latin1 PAGE_CHECKSUM=1 TRANSACTIONAL=1

1 row in set (0.000 sec)

And in the table status, you can check both the transactional and row format values:

MariaDB [db1]> SHOW TABLE STATUS\G

*************************** 1. row ***************************

            Name: table1

          Engine: Aria

         Version: 10

      Row_format: Page

            Rows: 0

  Avg_row_length: 0

     Data_length: 8192

 Max_data_length: 17592186011648

    Index_length: 8192

       Data_free: 0

  Auto_increment: NULL

     Create_time: 2020-06-30 18:59:17

     Update_time: 2020-06-30 18:59:17

      Check_time: NULL

       Collation: latin1_swedish_ci

        Checksum: NULL

  Create_options: transactional=1

         Comment:

Max_index_length: 137438945280

       Temporary: N

1 rows in set (0.001 sec)

There are many parameters to configure related to Aria Storage Engine. You can find a full list in the official documentation site.

Aria Storage Engine Tools

Let’s see some tools for working with this storage engine.

aria_chk

Aria_chk is used to check, repair, optimize, sort, and get information about Aria tables. With the MariaDB server, you can use CHECK TABLE, REPAIR TABLE, and OPTIMIZE TABLE to do similar things.

This tool should not be used when MariaDB is running as it assumes the table won’t be changed during his usage.

$ aria_chk [OPTIONS] aria_tables[.MAI]

Similar to MyISAM, the Aria table information is stored in 2 different files: 

  • MAI file contains base table information and the index.
  • MAD file contains the data. 
Aria_chk takes one or more MAI files as arguments.

For example, to check all your tables and repairs only those that have an error, run this command in your data directory:

$ aria_chk --check --force --sort_buffer_size=1G */*.MAI

Checking Aria file: db1/table1.MAI

Data records:       0   Deleted blocks:       0

- check file-size

- check key delete-chain

- check index reference

- check record links

...

aria_pack

Aria_pack is a tool for compressing Aria tables. The resulting tables are read-only, and usually about 40% to 70% smaller. The file name used by this tool is the .MAI index file.

$ aria_pack [options] file_name [file_name2...]

Aria_pack compresses each column separately, and, when the resulting data is read, only the individual rows and columns required need to be decompressed, allowing for quicker reading.

$ aria_pack /var/lib/mysql/world/country

Compressing aria_pack /var/lib/mysql/world/country.MAD: (549 records)

- Calculating statistics

- Compressing file

37.71%

Remember to run aria_chk -rq on compressed tables

Once a table has been packed, use the command aria_chk -rq to rebuild its indexes.

$ aria_chk -rq --ignore-control-file /var/lib/mysql/world/country

Recreating table '/var/lib/mysql/world/country'

- check record delete-chain

- recovering (with sort) Aria-table '/var/lib/mysql/world/country'

Data records: 549

- Fixing index 1

State updated

aria_read_log

Aria_read_log is a tool for displaying and applying log records from an Aria transaction log.

$ aria_read_log OPTIONS

You need to use one of “-d” or “-a” options:

  • a: Apply log to tables: modifies tables. You should make a backup first. Displays a lot of information if you don’t use the --silent parameter.
  • d: Display brief info read from records' header.
$ cd /var/lib/mysql

$ aria_read_log -d

You are using --display-only, NOTHING will be written to disk

The transaction log starts from lsn (1,0x2007)

TRACE of the last aria_read_log

Rec#1 LSN (1,0x2007) short_trid 0 redo_create_table(num_type:30) len 1042

Rec#2 LSN (1,0x2421) short_trid 0 redo_create_table(num_type:30) len 527

Rec#3 LSN (1,0x2638) short_trid 61986 long_transaction_id(num_type:36) len 6

Rec#4 LSN (1,0x2641) short_trid 61986 file_id(num_type:35) len 22

Rec#5 LSN (1,0x265d) short_trid 61986 undo_bulk_insert(num_type:39) len 9

Rec#6 LSN (1,0x266a) short_trid 0 incomplete_log(num_type:37) len 2

Rec#7 LSN (1,0x266f) short_trid 61986 commit(num_type:27) len 0

...

Conclusion

As you can see, Aria Storage Engine has many improvements against MyISAM, and it is a great storage engine alternative to be used. It is also easy to use as it is part of the MariaDB Server installation, so just by specifying the ENGINE table parameter is enough to enable it.

MariaDB is still working on this storage engine, so probably we will see new improvements in future versions soon.

Introduction to MaxScale Administration Using maxctrl for MariaDB Cluster

$
0
0

MariaDB Cluster consists of MariaDB Server with Galera Cluster and MariaDB MaxScale. As a multi-master replication solution, any MariaDB Server with Galera Cluster can operate as a primary server. This means that changes made to any node in the cluster replicate to every other node in the cluster, using certification-based replication and global ordering of transactions for the InnoDB storage engine. MariaDB MaxScale is a database proxy, sitting on top of the MariaDB Server that extends the high availability, scalability, and security while at the same time simplifying application development by decoupling it from the underlying database infrastructure. 

In this blog series, we are going to look at the MaxScale administration using maxctrl for our MariaDB Cluster. In this first installment of the blog series, we are going to cover the introduction and some basics of maxctrl command-line utility. Our setup consists of one MaxScale server and a 3-node MariaDB 10.4 with Galera 4, as illustrated in the following diagram:

Maxscale ClusterControl Diagram

Our MariaDB Cluster was deployed and managed by ClusterControl, while our MaxScale host is a new host in the cluster and was not deployed by ClusterControl for the purpose of this walkthrough.

MaxScale Installation

The MaxScale installation is pretty straightforward. Choose the right operating system from the MariaDB download page for MaxScale and download it. The following example shows how one would install MaxScale on a CentOS 8 host:

$ wget https://dlm.mariadb.com/1067156/MaxScale/2.4.10/centos/8/x86_64/maxscale-2.4.10-1.centos.8.x86_64.rpm
$ yum localinstall maxscale-2.4.10-1.centos.8.x86_64.rpm
$ systemctl enable maxscale
$ systemctl start maxscale

After the daemon is started, by default, MaxScale components will be running on the following ports:

  • 0.0.0.0:4006 - Default read-write splitting listener.
  • 0.0.0.0:4008 - Default round-robin listener.
  • 127.0.0.1:8989 - MaxScale Rest API.

The above ports are changeable. It is common for a standalone MaxScale server in production to be running with the read/write split on port 3306 and round-robin on port 3307. This configuration is what we are going to deploy in this blog post.

Important Files and Directory Structure

Once the package is installed, you will get the following utilities/programs:

  • maxscale - The MaxScale itself. 
  • maxctrl - The command-line administrative client for MaxScale which uses the MaxScale REST API for communication.
  • maxadmin - The deprecated MaxScale administrative and monitor client. Use maxctrl instead.
  • maxkeys - This utility writes into the file .secrets, in the specified directory, the AES encryption key and init vector that is used by the utility maxpasswd, when encrypting passwords used in the MariaDB MaxScale configuration file.
  • maxpasswd - This utility creates an encrypted password using a .secrets file that has earlier been created using maxkeys.

MaxScale will load all the configuration options from the following locations, in the particular order:

  1. /etc/maxscale.cnf
  2. /etc/maxscale.cnf.d/*.cnf
  3. /var/lib/maxscale/maxscale.cnf.d/*.cnf

To understand further on MaxScale configuration, check out the MaxScale Configuration Guide.

Once MaxScale is initialized, the default files and directory structures are:

  • MaxScale data directory: /var/lib/maxscale
  • MaxScale PID file: /var/run/maxscale/maxscale.pid
  • MaxScale log file: /var/log/maxscale/maxscale.log
  • MaxScale documentation: /usr/share/maxscale

MaxCtrl - The CLI

Once started, we can use the MaxCtrl command-line client to administer the MaxScale by using the MaxScale REST API listens on port 8989 on the localhost. The default credentials for the REST API are "admin:mariadb". The users used by the REST API are the same that are used by the MaxAdmin network interface. This means that any users created for the MaxAdmin network interface should work with the MaxScale REST API and MaxCtrl.

We can use the maxctrl utility in interactive mode, similar to the mysql client. Just type "maxctrl" and you will get into the interactive mode (where the prompt changed from the shell prompt to maxctrl prompt), just like the following screenshot:

MariaDB Maxscale CLI maxctrl

Alternatively, we can execute the very same command directly in the shell prompt, for example:

MariaDB Maxscale CLI maxctrl

MaxCtrl command options are depending on the MaxScale version that comes with it. At the time of this writing, the MaxScale version is 2.4 and you should look into this documentation for a complete list of commands. MaxCtrl utilizes the MaxScale REST API interface, which explains in detail here.

Adding MariaDB Servers into MaxScale

When we first start our MaxScale, it will generate a configuration file at /etc/maxscale.cnf with some default parameters and examples. We are not going to use this configuration and we are going to create our own instead. Create a backup of this file because we want to empty it later on:

$ mv /etc/maxscale.cnf /etc/maxscale.cnf.bak
$ cat /dev/null > /etc/maxscale.cnf # empty the file

Restart the MaxScale to start everything fresh:

$ systemctl restart maxscale

The term "server" in MaxScale basically means the backend MariaDB server, as in this case, all 3 nodes of our MariaDB Cluster. To add all the 3 MariaDB Cluster servers into MaxScale runtime, use the following commands:

$ maxctrl create server mariadbgalera1 192.168.0.221 3306
$ maxctrl create server mariadbgalera2 192.168.0.222 3306
$ maxctrl create server mariadbgalera3 192.168.0.222 3306

To verify the added servers, use the list command:

$ maxctrl list servers

And you should see the following output:

Adding Monitoring into MaxScale

The next thing is to configure the monitoring service for MaxScale usage. MaxScale supports a number of monitoring modules depending on the database type, namely:

  • MariaDB Monitor
  • Galera Monitor
  • Clustrix Monitor
  • ColumnStore Monitor
  • Aurora Monitor

In this setup, we are going to use the Galera Monitor module called "galeramon". Firstly, we need to create a database user to be used by MaxScale on one of the servers in the MariaDB Cluster. In this example we picked mariadbgalera1, 192.168.0.221 to run the following statements:

MariaDB> CREATE USER maxscale_monitor@'192.168.0.220' IDENTIFIED BY 'MaXSc4LeP4ss';
MariaDB> GRANT SELECT ON mysql.* TO 'maxscale_monitor'@'192.168.0.220';
MariaDB> GRANT SHOW DATABASES ON *.* TO 'maxscale_monitor'@'192.168.0.220';

Where 192.168.0.220 is the IP address of our MaxScale server.

It's not safe to store the maxscale_monitor user password in plain text. It's highly recommended to store the password in an encrypted format instead. To achieve this, we need to generate a secret key specifically for this MaxScale instance. Use the "maxkeys" utility to generate the secret key that will be used by MaxScale for encryption and decryption purposes:

$ maxkeys
Generating .secrets file in /var/lib/maxscale.

Now we can use the maxpasswd utility to generate the encrypted value of our password:

$ maxpasswd MaXSc4LeP4ss
D91DB5813F7C815B351CCF7D7F1ED6DB

We will always use the above value instead when storing our monitoring user credentials inside MaxScale. Now we are ready to add the Galera monitoring service into MaxScale using maxctrl:

maxctrl> create monitor galera_monitor galeramon servers=mariadbgalera1,mariadbgalera2,mariadbgalera3 user=maxscale_monitor password=D91DB5813F7C815B351CCF7D7F1ED6DB

Verify with the following command:

Adding Services into MaxScale

Service is basically how MaxScale should route the queries to the backend servers. MaxScale 2.4 supports multiple services (or routers), namely:

  • Avrorouter
  • Binlogrouter
  • Cat
  • CLI
  • HintRouter
  • Readconnroute
  • Readwritesplit
  • SchemaRouter
  • SmartRouter

For our MariaDB Cluster, we only need two routing services - Read-write split and round-robin load balancing. For read-write splitting, write queries will be forwarded to only a single MariaDB server until the server is unreachable, where MaxScale will then forward the write queries to the next available node. For round-robin balancing, the queries will be forwarded to all of the backend nodes in a round-robin fashion.

Create a routing service for round-robin (or multi-master):

maxctrl> create service Round-Robin-Service readconnroute user=maxscale_monitor password=D91DB5813F7C815B351CCF7D7F1ED6DB --servers mariadbgalera1 mariadbgalera2 mariadbgalera3

Create another routing service for read-write splitting (or single-master):

maxctrl> create service Read-Write-Service readwritesplit user=maxscale_monitor password=D91DB5813F7C815B351CCF7D7F1ED6DB --servers mariadbgalera1 mariadbgalera2 mariadbgalera3

Verify with:

All the successfully created components by MaxCtrl will generate its own configuration file under /var/lib/maxscale/maxscale.cnf.d. At this point, the directory looks like this:

$ ls -l /var/lib/maxscale/maxscale.cnf.d
total 24
-rw-r--r--. 1 maxscale maxscale  532 Jul  5 13:18 galera_monitor.cnf
-rw-r--r--. 1 maxscale maxscale  250 Jul  5 12:55 mariadbgalera1.cnf
-rw-r--r--. 1 maxscale maxscale  250 Jul  5 12:55 mariadbgalera2.cnf
-rw-r--r--. 1 maxscale maxscale  250 Jul  5 12:56 mariadbgalera3.cnf
-rw-r--r--. 1 maxscale maxscale 1128 Jul  5 16:01 Read-Write-Service.cnf
-rw-r--r--. 1 maxscale maxscale  477 Jul  5 16:00 Round-Robin-Service.cnf

Adding Listeners into MaxScale

Listeners represent the ports the service will listen to incoming connections. It can be a port or UNIX socket file and the component type must be "listener". Commonly, listeners are tied to services. In our setup, we are going to create two listeners - Read-Write Listener on port 3306 and Round-Robin Listener on port 3307:

maxctrl> create listener Read-Write-Service Read-Write-Listener 3306 --interface=0.0.0.0 --authenticator=MariaDBAuth
maxctrl> create listener Round-Robin-Service Round-Robin-Listener 3307 --interface=0.0.0.0 --authenticator=MariaDBAuth

Verify with the following commands:

At this point, our MaxScale is now ready to load balance the queries to our MariaDB Cluster. From the applications, send the queries to the MaxScale host on port 3306, where the write queries will always hit the same database node while the read queries will be sent to the other two nodes. This is also known as a single-writer setup. If you would like to use a multi-writer setup, where writes will be forwarded to all backend MariaDB nodes based on round-robin balancing algorithms. You can further fine-tune the balancing by using priority and weight.

Again, when changing the configuration options via maxctrl, all successfully created components will have its own configuration file inside /var/lib/maxscale/maxscale.cnf.d, as shown in the following output:

$ ls -l /var/lib/maxscale/maxscale.cnf.d
-rw-r--r--. 1 maxscale maxscale  532 Jul  5 13:18 galera_monitor.cnf
-rw-r--r--. 1 maxscale maxscale  250 Jul  5 12:55 mariadbgalera1.cnf
-rw-r--r--. 1 maxscale maxscale  250 Jul  5 12:55 mariadbgalera2.cnf
-rw-r--r--. 1 maxscale maxscale  250 Jul  5 12:56 mariadbgalera3.cnf
-rw-r--r--. 1 maxscale maxscale  259 Jul  5 16:06 Read-Write-Listener.cnf
-rw-r--r--. 1 maxscale maxscale 1128 Jul  5 16:06 Read-Write-Service.cnf
-rw-r--r--. 1 maxscale maxscale  261 Jul  5 16:06 Round-Robin-Listener.cnf
-rw-r--r--. 1 maxscale maxscale  477 Jul  5 16:06 Round-Robin-Service.cnf

The above configuration options can be directly modified to further suit your needs, but it requires the MaxScale service to be restarted to load the new changes. If you would like to start fresh again, you could wipe everything under this directory and restart MaxScale.

In the next episode, we will look into MaxCtrl's management and monitoring commands for our MariaDB Cluster.

Viewing all 327 articles
Browse latest View live