Quantcast
Channel: Severalnines - MariaDB
Viewing all 327 articles
Browse latest View live

Become a ClusterControl DBA: Operational Reports for MySQL, MariaDB, PostgreSQL & MongoDB

$
0
0

The majority of DBA’s perform health checks on their databases every now and then. Usually, it would happen on a daily or weekly basis. We previously discussed why such checks are important and what they should include.

To make sure your systems are in a good shape, you’d need to go through quite a lot of information - host statistics, MySQL statistics, workload statistics, state of backups, database packages, logs and so forth. Such data should be available in every properly monitored environment, although sometimes it is scattered across multiple locations - you may have one tool to monitor MySQL state, another tool to collect system statistics, maybe a set of scripts, e.g., to check the state of your backups. This makes health checks much more time-consuming than they should be - the DBA has to put together the different pieces to understand the state of the system.

Integrated tools like ClusterControl have an advantage that all of the bits are located in the same place (or in the same application). It still does not mean they are located next to each other - they may be located in different sections of the UI and a DBA may have to spend some time clicking through the UI to reach all the interesting data.

The whole idea behind creating Operational Reports is to put all of the most important data into a single document, which can be quickly reviewed to get an understanding of the state of the databases.

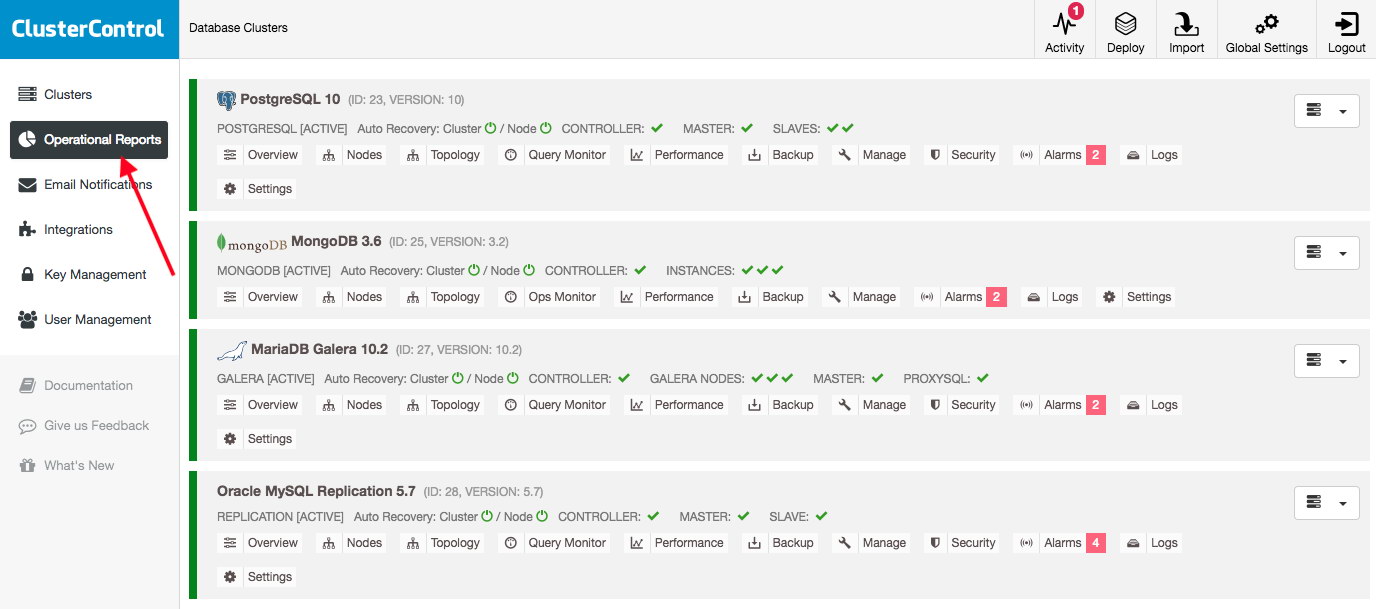
Operational Reports are available from the menu Side Menu -> Operational Reports:

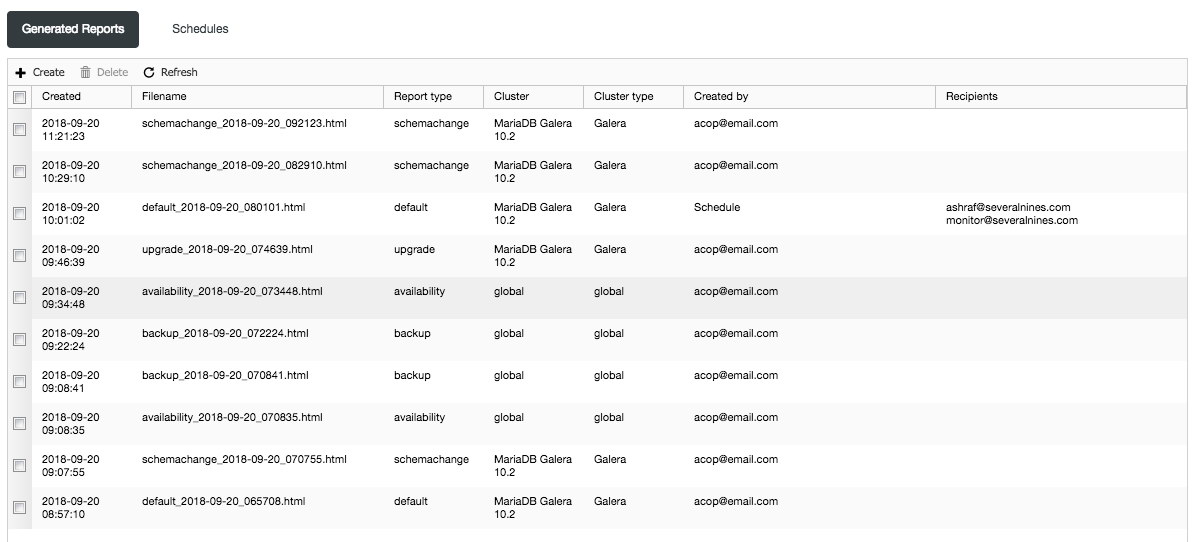
Once you go there, you’ll be presented with a list of reports created manually or automatically, based on a predefined schedule:

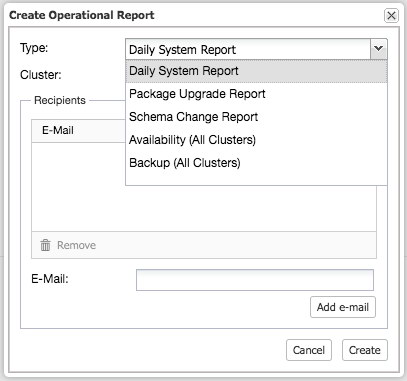
If you want to create a new report manually, you’ll use the 'Create' option. Pick the type of report, cluster name (for per-cluster report), email recipients (optional - if you want the report to be delivered to you), and you’re pretty much done:

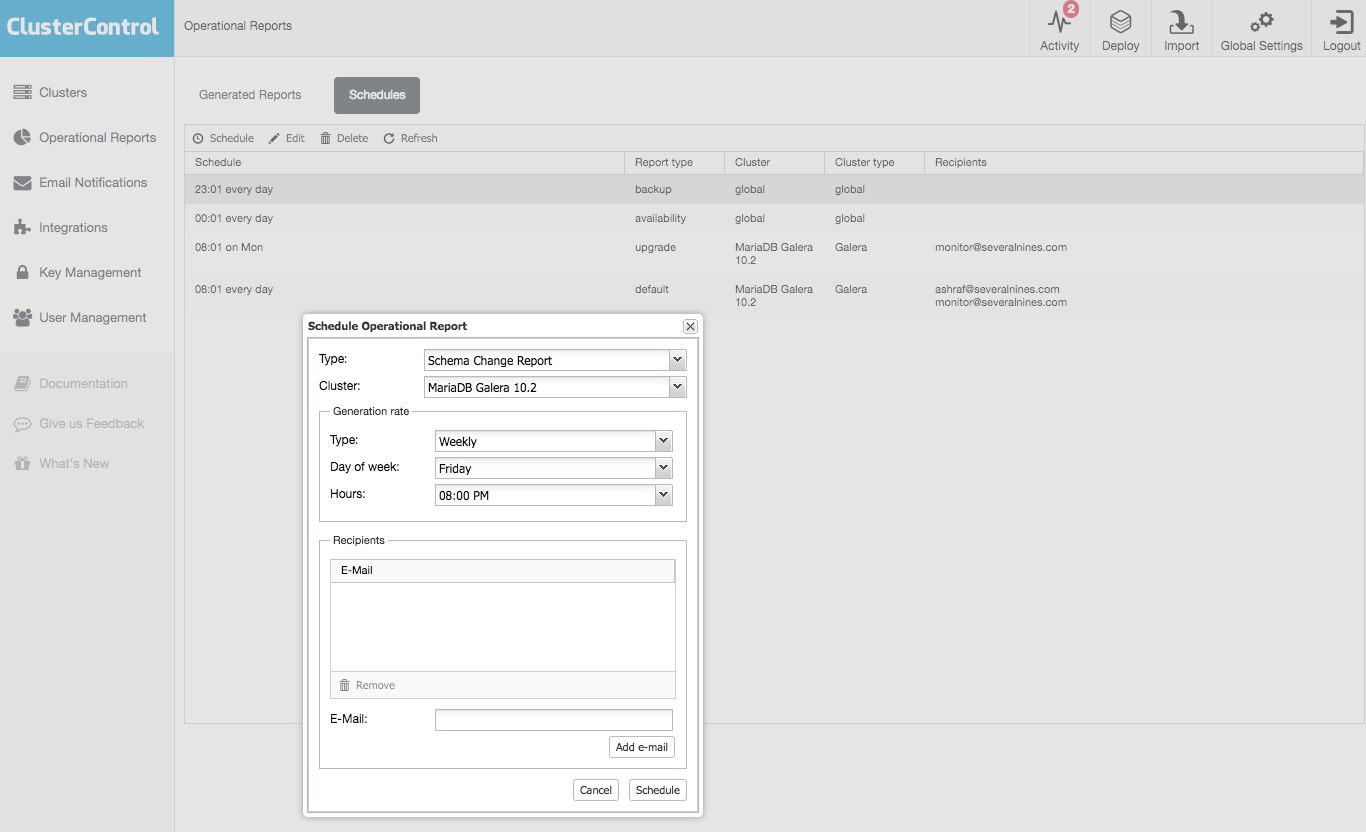
The reports can also be scheduled to be created on a regular basis:

At this time, 5 types of reports are available:

  • Availability report - All clusters.
  • Backup report - All clusters.
  • Schema change report - MySQL/MariaDB-based cluster only.
  • Daily system report - Per cluster.
  • Package upgrade report - Per cluster.

Availability Report

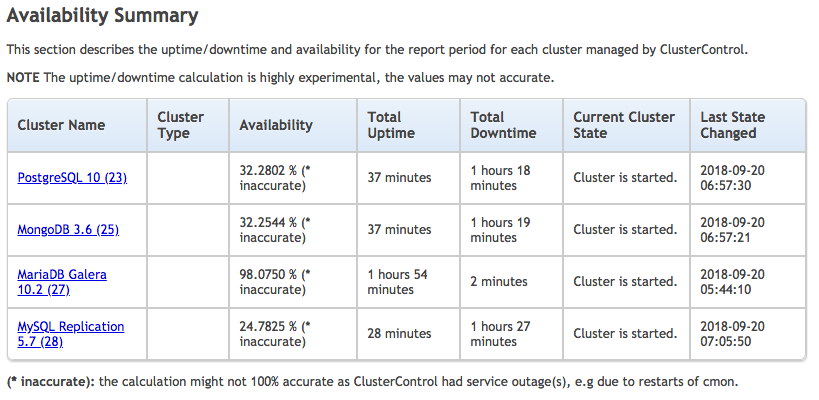
Availability reports focuses on, well, availability. It includes three sections. First, availability summary:

You can see information about availability statistics of your databases, the cluster type, total uptime and downtime, current state of the cluster and when that state last changed.

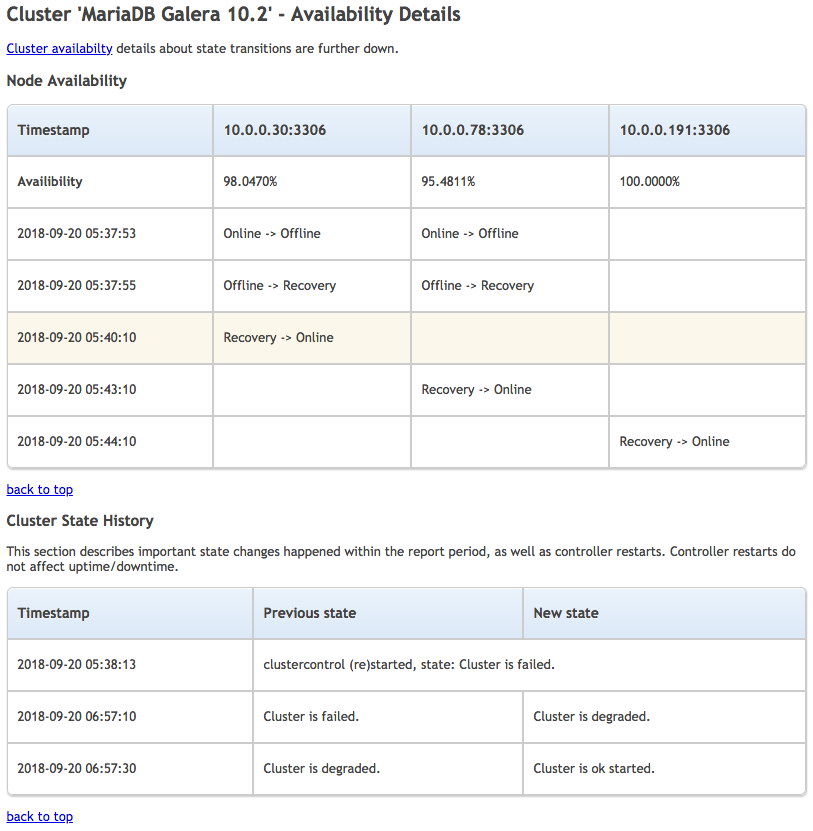
Another section gives more details on availability for every cluster. The screenshot below only shows one of the database cluster:

We can see when a node switched state and what the transition was. It’s a nice place to check if there were any recent problems with the cluster. Similar data is shown in the third section of this report, where you can go through the history of changes in cluster state.

Backup Report

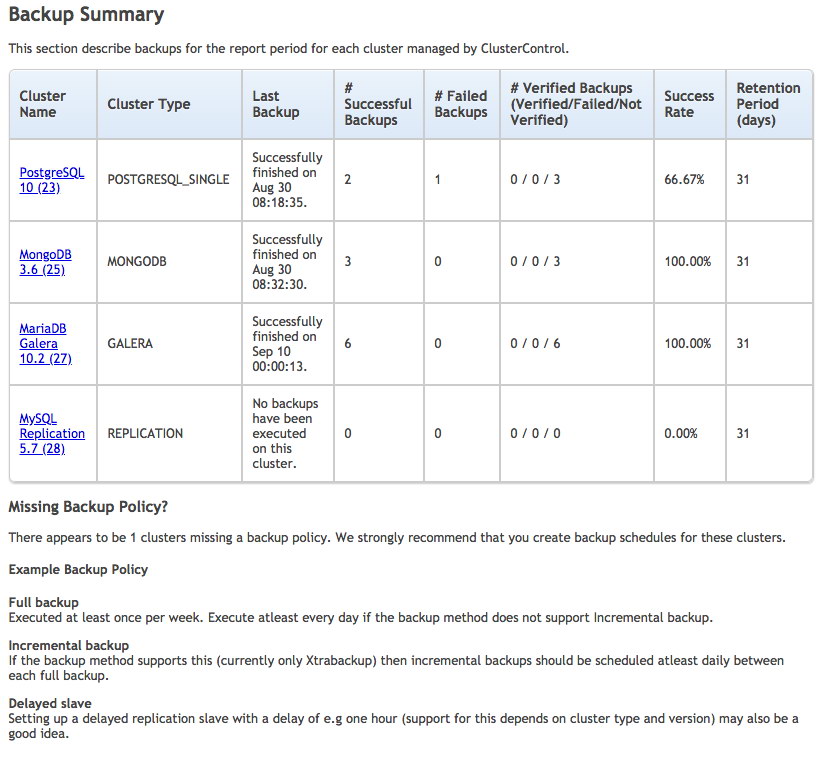
The second type of the report is one covering backups of all clusters. It contains two sections - backup summary and backup details, where the former basically gives you a short summary of when the last backup was created, if it completed successfully or failed, backup verification status, success rate and retention period:

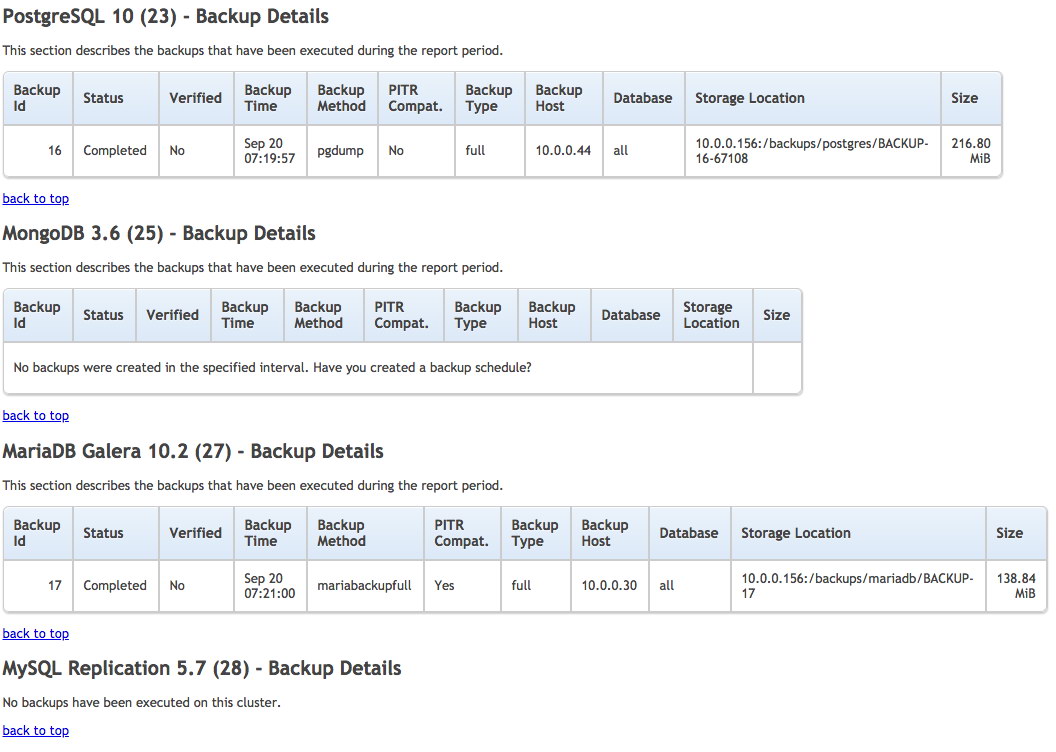
ClusterControl also provides examples of backup policy if it finds any of the monitored database cluster running without any scheduled backup or delayed slave configured. Next are the backup details:

You can also check the list of backups executed on the cluster with their state, type and size within the specified interval. This is as close you can get to be certain that backups work correctly without running a full recovery test. We definitely recommend that such tests are performed every now and then. Good news is ClusterControl supports MySQL-based restoration and verification on a standalone host under Backup -> Restore Backup.

Daily System Report

This type of report contains detailed information about a particular cluster. It starts with a summary of different alerts which are related to the cluster:

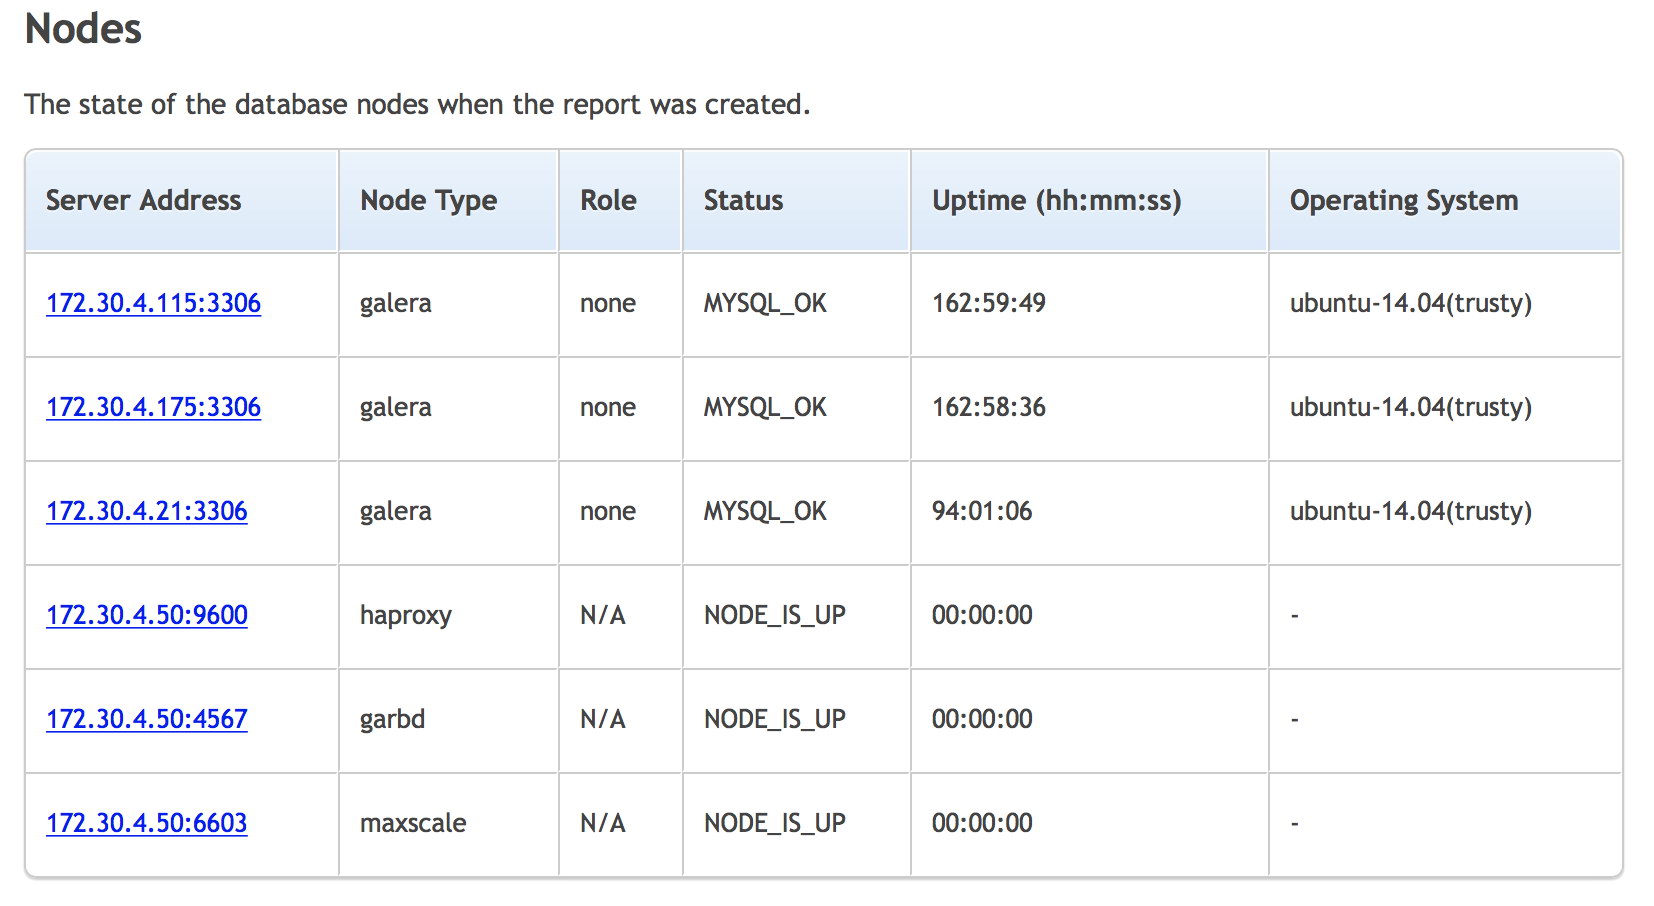
Next section is about the state of the nodes that are part of the cluster:

You have a list of the nodes in the cluster, their type, role (master or slave), status of the node, uptime and the OS.

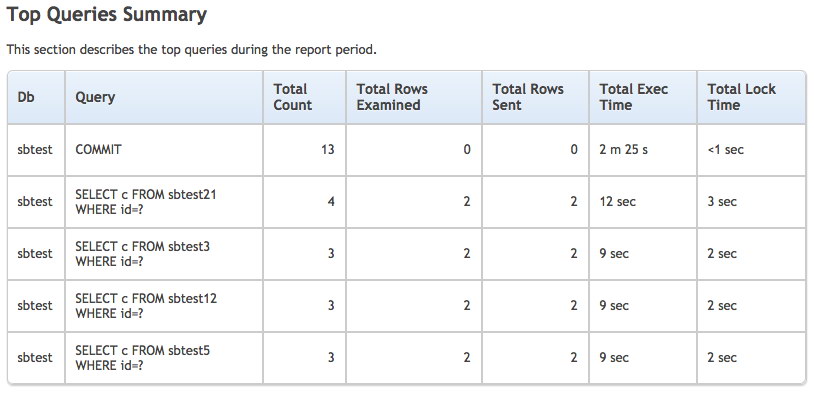
Another section of the report is the backup summary, same as we discussed above. Next one presents a summary of top queries in the cluster:

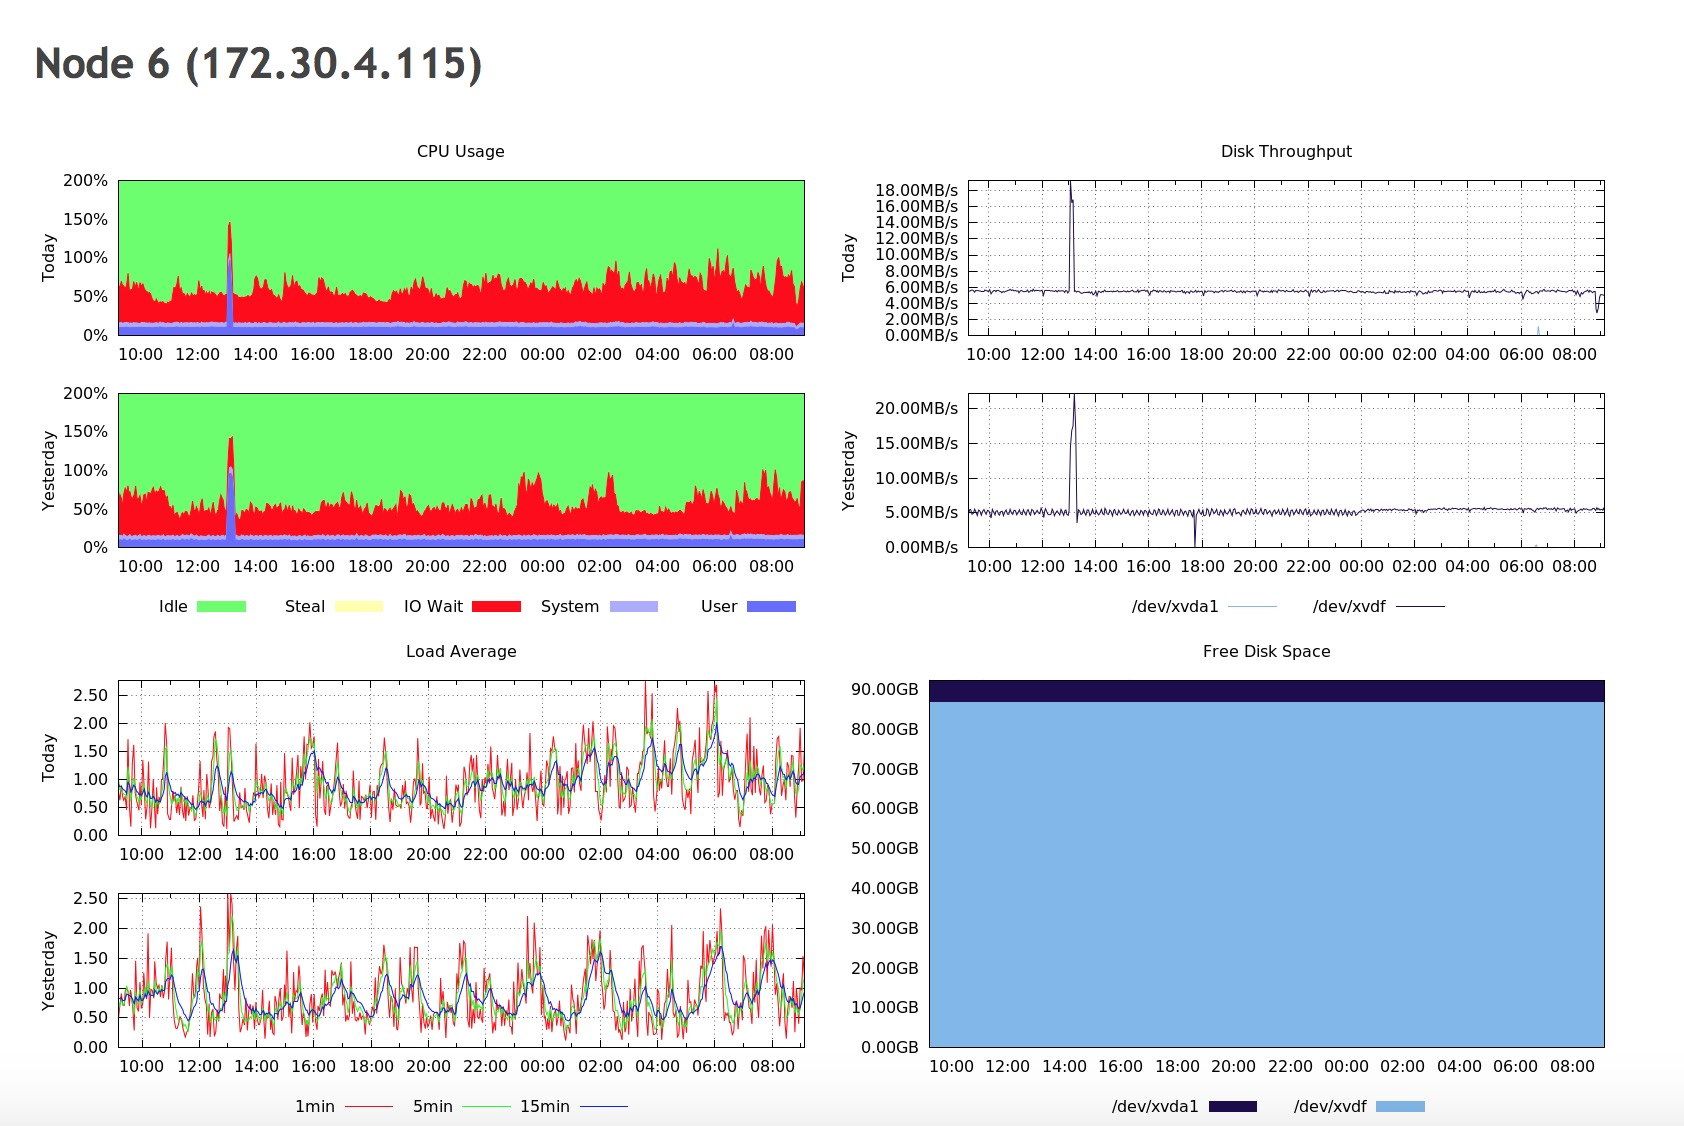
Finally, we see a “Node status overview” in which you’ll be presented with graphs related to OS and MySQL metrics for each node.

As you can see, we have here graphs covering all of the aspects of the load on the host - CPU, memory, network, disk, CPU load and disk free. This is enough to get an idea whether anything weird happened recently or not. You can also see some details about MySQL workload - how many queries were executed, which type of query, how the data was accessed (via which handler)? This, on the other hand, should be enough to pick most of the issues on MySQL side. What you want to look at are all spikes and dips that you haven’t seen in the past. Maybe a new query has been added to the mix and, as a result, handler_read_rnd_next skyrocketed? Maybe there was an increase of CPU load and a high number of connections might point to increased load on MySQL, but also to some kind of contention. An unexpected pattern might be good to investigate, so you know what is going on.

Package Upgrade Report

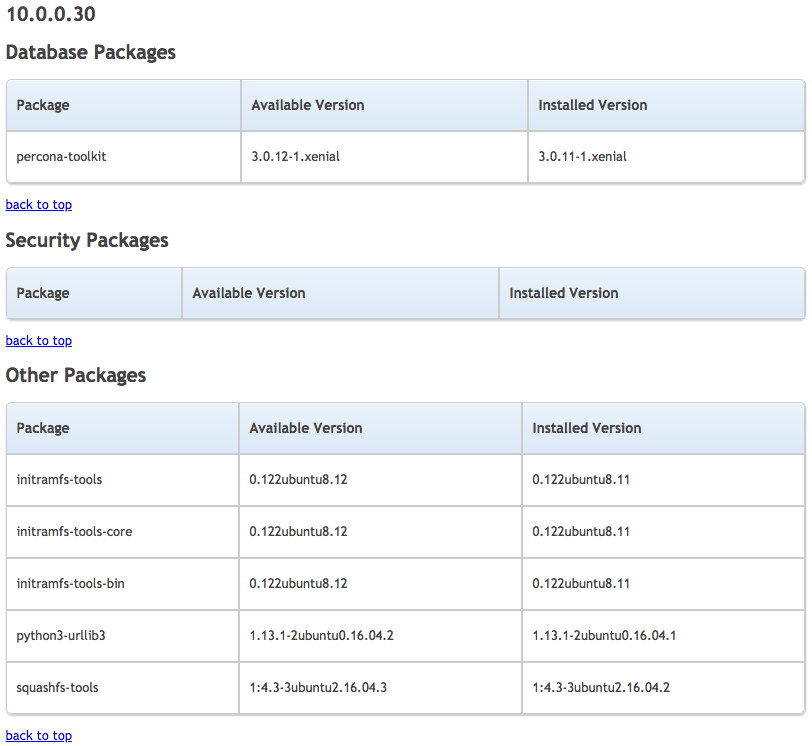
This report gives a summary of packages available for upgrade by the repository manager on the monitored hosts. For an accurate reporting, ensure you always use stable and trusted repositories on every host. In some undesirable occasions, the monitored hosts could be configured with an outdated repository after an upgrade (e.g, every MariaDB major version uses different repository), incomplete internal repository (e.g, partial mirrored from the upstream) or bleeding edge repository (commonly for unstable nightly-build packages).

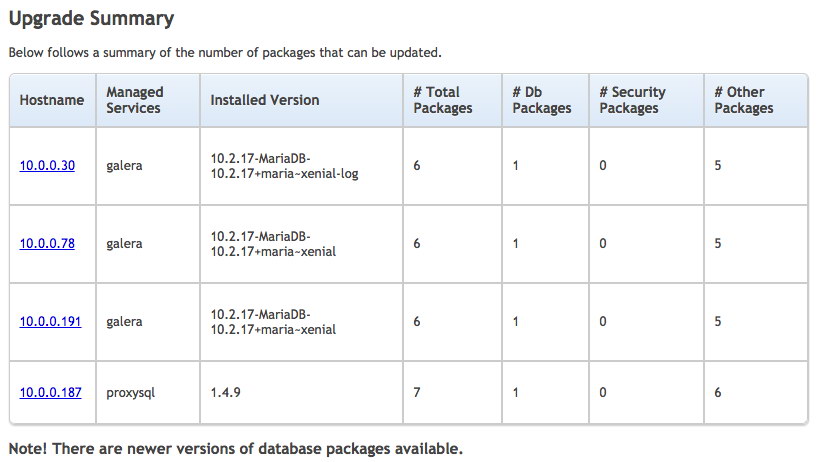
The first section is the upgrade summary:

It summarizes the total number of packages available for upgrade as well as the related managed service for the cluster like load balancer, virtual IP address and arbitrator. Next, ClusterControl provides a detailed package list, grouped by package type for every host:

This report provides the available version and can greatly help us plan our maintenance window efficiently. For critical upgrades like security and database packages, we could prioritize it over non-critical upgrades, which could be consolidated with other less priority maintenance windows.

Schema Change Report

This report compares the selected MySQL/MariaDB database changes in table structure which happened between two different generated reports. In the MySQL/MariaDB older versions, DDL operation is a non-atomic operation (pre 8.0) and requires full table copy (pre 5.6 for most operations) - blocking other transactions until it completes. Schema changes could become a huge pain once your tables get a significant amount of data and must be carefully planned especially in a clustered setup. In a multi-tiered development environment, we have seen many cases where developers silently modify the table structure, resulting in significant impact to query performance.

In order for ClusterControl to produce an accurate report, special options must be configured inside CMON configuration file for the respective cluster:

  • schema_change_detection_address - Checks will be executed using SHOW TABLES/SHOW CREATE TABLE to determine if the schema has changed. The checks are executed on the address specified and is of the format HOSTNAME:PORT. The schema_change_detection_databases must also be set. A differential of a changed table is created (using diff).
  • schema_change_detection_databases - Comma separated list of databases to monitor for schema changes. If empty, no checks are made.

In this example, we would like to monitor schema changes for database "myapp" and "sbtest" on our MariaDB Cluster with cluster ID 27. Pick one of the database nodes as the value of schema_change_detection_address. For MySQL replication, this should be the master host, or any slave host that holds the databases (in case partial replication is active). Then, inside /etc/cmon.d/cmon_27.cnf, add the two following lines:

schema_change_detection_address=10.0.0.30:3306
schema_change_detection_databases=myapp,sbtest

Restart CMON service to load the change:

$ systemctl restart cmon

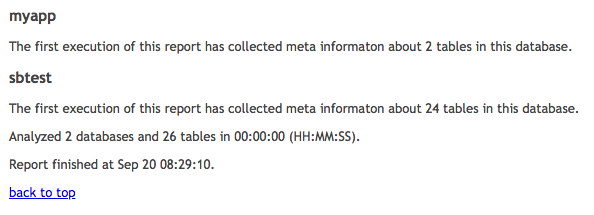
For the first and foremost report, ClusterControl only returns the result of metadata collection, similar to below:

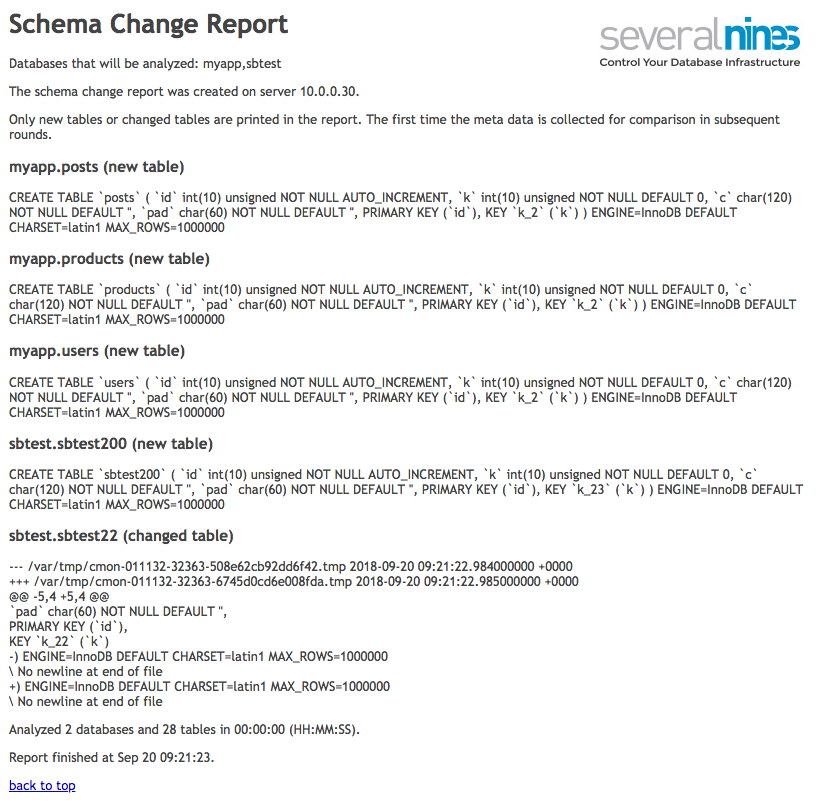
With the first report as the baseline, the subsequent reports will return the output that we are expecting for:

Take note only new tables or changed tables are printed in the report. The first report is only for metadata collection for comparison in the subsequent rounds, thus we have to run it for at least twice to see the difference.

With this report, you can now gather the database structure footprints and understand how your database has evolved across time.

Final Thoughts

Operational report is a comprehensive way to understand the state of your database infrastructure. It is built for both operational or managerial staff, and can be very useful in analysing your database operations. The reports can be generated in-place or can be delivered to you via email, which make things conveniently easy if you have a reporting silo.

We’d love to hear your feedback on anything else you’d like to have included in the report, what’s missing and what is not needed.


Introducing Agent-Based Database Monitoring with ClusterControl 1.7

$
0
0

We are excited to announce the 1.7 release of ClusterControl - the only management system you’ll ever need to take control of your open source database infrastructure!

ClusterControl 1.7 introduces new exciting agent-based monitoring features for MySQL, Galera Cluster, PostgreSQL & ProxySQL, security and cloud scaling features ... and more!

Release Highlights

Monitoring & Alerting

  • Agent-based monitoring with Prometheus
  • New performance dashboards for MySQL, Galera Cluster, PostgreSQL & ProxySQL

Security & Compliance

  • Enable/disable Audit Logging on your MariaDB databases
  • Enable policy-based monitoring and logging of connection and query activity

Deployment & Scaling

  • Automatically launch cloud instances and add nodes to your cloud deployments

Additional Highlights

  • Support for MariaDB v10.3

View the ClusterControl ChangeLog for all the details!

ClusterControl
Single Console for Your Entire Database Infrastructure
Find out what else is new in ClusterControl

View Release Details and Resources

Release Details

Monitoring & Alerting

Agent-based monitoring with Prometheus

ClusterControl was originally designed to address modern, highly distributed database setups based on replication or clustering. It provides a systems view of all the components of a distributed cluster, including load balancers, and maintains a logical topology view of the cluster.

So far we’d gone the agentless monitoring route with ClusterControl, and although we love the simplicity of not having to install or manage agents on the monitored database hosts, an agent-based approach can provide higher resolution of monitoring data and has certain advantages in terms of security.

With that in mind, we’re happy to introduce agent-based monitoring as a new feature added in ClusterControl 1.7!

It makes use of Prometheus, a full monitoring and trending system that includes built-in and active scraping and storing of metrics based on time series data. One Prometheus server can be used to monitor multiple clusters. ClusterControl takes care of installing and maintaining Prometheus as well as exporters on the monitored hosts.

Users can now enable their database clusters to use Prometheus exporters to collect metrics on their nodes and hosts, thus avoiding excessive SSH activity for monitoring and metrics collections and use SSH connectivity only for management operations.

Monitoring & Alerting

New performance dashboards for MySQL, Galera Cluster, PostgreSQL & ProxySQL

ClusterControl users now have access to a set of new dashboards that have Prometheus as the data source with its flexible query language and multi-dimensional data model, where time series data is identified by metric name and key/value pairs. This allows for greater accuracy and customization options while monitoring your database clusters.

The new dashboards include:

  • Cross Server Graphs
  • System Overview
  • MySQL Overview, Replication, Performance Schema & InnoDB Metrics
  • Galera Cluster Overview & Graphs
  • PostgreSQL Overview
  • ProxySQL Overview

Security & Compliance

Audit Log for MariaDB

Continuous auditing is an imperative task for monitoring your database environment. By auditing your database, you can achieve accountability for actions taken or content accessed. Moreover, the audit may include some critical system components, such as the ones associated with financial data to support a precise set of regulations like SOX, or the EU GDPR regulation. Usually, it is achieved by logging information about DB operations on the database to an external log file.

With ClusterControl 1.7 users can now enable a plugin that will log all of their MariaDB database connections or queries to a file for further review; it also introduces support for version 10.3 of MariaDB.

Additional New Functionalities

View the ClusterControl ChangeLog for all the details!

Download ClusterControl today!

Happy Clustering!

New White Paper on State-of-the-Art Database Management: ClusterControl - The Guide

$
0
0

Today we’re happy to announce the availability of our first white paper on ClusterControl, the only management system you’ll ever need to automate and manage your open source database infrastructure!

Download ClusterControl - The Guide!

Most organizations have databases to manage, and experience the headaches that come with that: managing performance, monitoring uptime, automatically recovering from failures, scaling, backups, security and disaster recovery. Organizations build and buy numerous tools and utilities for that purpose.

ClusterControl differs from the usual approach of trying to bolt together performance monitoring, automatic failover and backup management tools by combining – in one product – everything you need to deploy and operate mission-critical databases in production. It automates the entire database environment, and ultimately delivers an agile, modern and highly available data platform based on open source.

All-in-one management software - the ClusterControl features set:

Since the inception of Severalnines, we have made it our mission to provide market-leading solutions to help organisations achieve optimal efficiency and availability of their open source database infrastructures.

With ClusterControl, as it stands today, we are proud to say: mission accomplished!

Our flagship product is an integrated deployment, monitoring, and management automation system for open source databases, which provides holistic, real-time control of your database operations in an easy and intuitive experience, incorporating the best practices learned from thousands of customer deployments in a comprehensive system that helps you manage your databases safely and reliably.

Whether you’re a MySQL, MariaDB, PostgreSQL or MongoDB user (or a combination of these), ClusterControl has you covered.

Deploying, monitoring and managing highly available open source database clusters is not a small feat and requires either just as highly specialised database administration (DBA) skills … or professional tools and systems that non-DBA users can wield in order to build and maintain such systems, though these typically come with an equally high learning curve.

The idea and concept for ClusterControl was born out of that conundrum that most organisations face when it comes to running highly available database environments.

It is the only solution on the market today that provides that intuitive, easy to use system with the full set of tools required to manage such complex database environments end-to-end, whether one is a DBA or not.

The aim of this Guide is to make the case for comprehensive open source database management and the need for cluster management software. And explains in a just as comprehensive fashion why ClusterControl is the only management system you will ever need to run highly available open source database infrastructures.

Download ClusterControl - The Guide!

MySQL on Docker: Running ProxySQL as a Helper Container on Kubernetes

$
0
0

ProxySQL commonly sits between the application and database tiers, in so called reverse-proxy tier. When your application containers are orchestrated and managed by Kubernetes, you might want to use ProxySQL in front of your database servers.

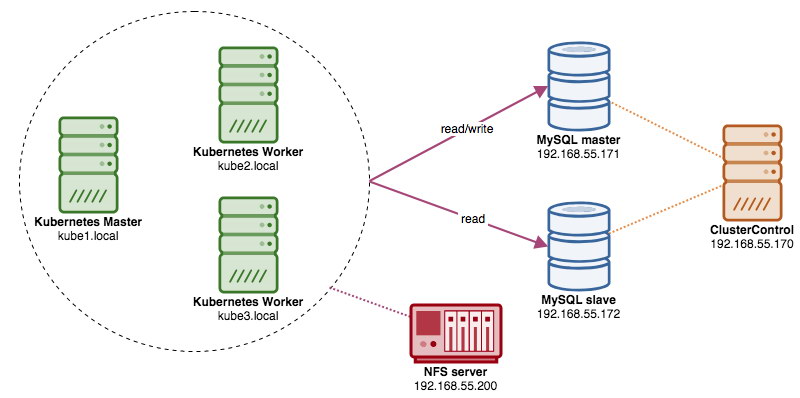
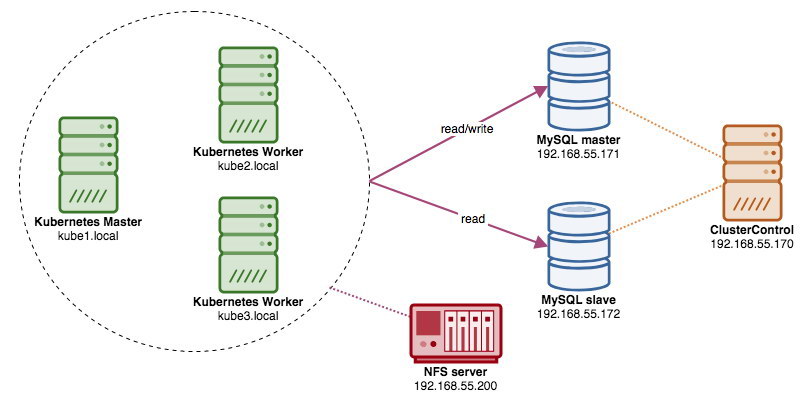
In this post, we’ll show you how to run ProxySQL on Kubernetes as a helper container in a pod. We are going to use Wordpress as an example application. The data service is provided by our two-node MySQL Replication, deployed using ClusterControl and sitting outside of the Kubernetes network on a bare-metal infrastructure, as illustrated in the following diagram:

ProxySQL Docker Image

In this example, we are going to use ProxySQL Docker image maintained by Severalnines, a general public image built for multi-purpose usage. The image comes with no entrypoint script and supports Galera Cluster (in addition to built-in support for MySQL Replication), where an extra script is required for health check purposes.

Basically, to run a ProxySQL container, simply execute the following command:

$ docker run -d -v /path/to/proxysql.cnf:/etc/proxysql.cnf severalnines/proxysql

This image recommends you to bind a ProxySQL configuration file to the mount point, /etc/proxysql.cnf, albeit you can skip this and configure it later using ProxySQL Admin console. Example configurations are provided in the Docker Hub page or the Github page.

ProxySQL on Kubernetes

Designing the ProxySQL architecture is a subjective topic and highly dependent on the placement of the application and database containers as well as the role of ProxySQL itself. ProxySQL does not only route queries, it can also be used to rewrite and cache queries. Efficient cache hits might require a custom configuration tailored specifically for the application database workload.

Ideally, we can configure ProxySQL to be managed by Kubernetes with two configurations:

  1. ProxySQL as a Kubernetes service (centralized deployment).
  2. ProxySQL as a helper container in a pod (distributed deployment).

The first option is pretty straightforward, where we create a ProxySQL pod and attach a Kubernetes service to it. Applications will then connect to the ProxySQL service via networking on the configured ports. Default to 6033 for MySQL load-balanced port and 6032 for ProxySQL administration port. This deployment will be covered in the upcoming blog post.

The second option is a bit different. Kubernetes has a concept called "pod". You can have one or more containers per pod, these are relatively tightly coupled. A pod’s contents are always co-located and co-scheduled, and run in a shared context. A pod is the smallest manageable container unit in Kubernetes.

Both deployments can be distinguished easily by looking at the following diagram:

The primary reason that pods can have multiple containers is to support helper applications that assist a primary application. Typical examples of helper applications are data pullers, data pushers, and proxies. Helper and primary applications often need to communicate with each other. Typically this is done through a shared filesystem, as shown in this exercise, or through the loopback network interface, localhost. An example of this pattern is a web server along with a helper program that polls a Git repository for new updates.

This blog post will cover the second configuration - running ProxySQL as a helper container in a pod.

ProxySQL as Helper in a Pod

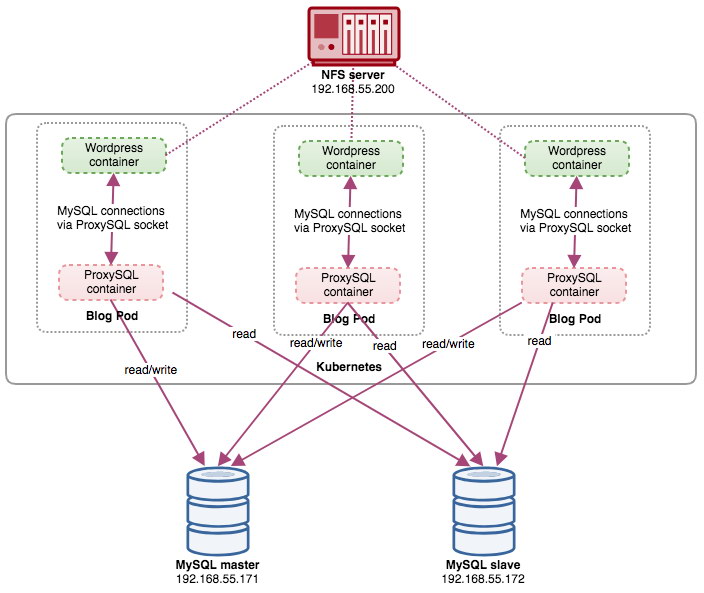
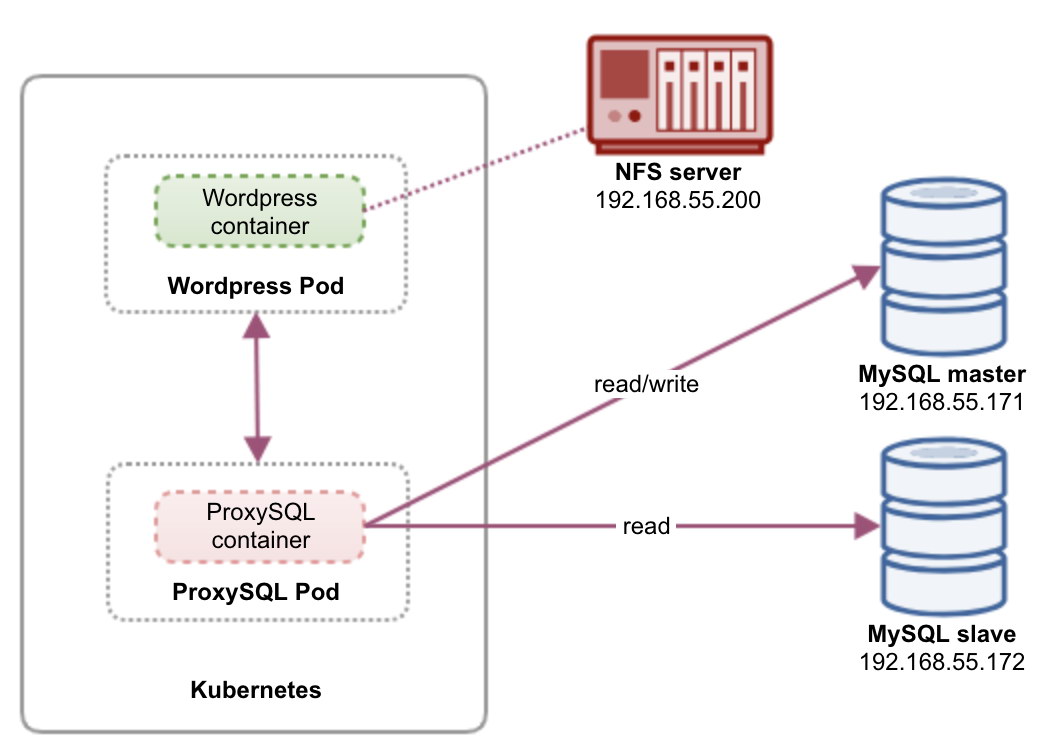
In this setup, we run ProxySQL as a helper container to our Wordpress container. The following diagram illustrates our high-level architecture:

In this setup, ProxySQL container is tightly coupled with the Wordpress container, and we named it as "blog" pod. If rescheduling happens e.g, the Kubernetes worker node goes down, these two containers will always be rescheduled together as one logical unit on the next available host. To keep the application containers' content persistent across multiple nodes, we have to use a clustered or remote file system, which in this case is NFS.

ProxySQL role is to provide a database abstraction layer to the application container. Since we are running a two-node MySQL Replication as the backend database service, read-write splitting is vital to maximize resource consumption on both MySQL servers. ProxySQL excels at this and requires minimal to no changes to the application.

There are a number of other benefits running ProxySQL in this setup:

  • Bring query caching capability closest to the application layer running in Kubernetes.
  • Secure implementation by connecting through ProxySQL UNIX socket file. It is like a pipe that the server and the clients can use to connect and exchange requests and data.
  • Distributed reverse proxy tier with shared nothing architecture.
  • Less network overhead due to "skip-networking" implementation.
  • Stateless deployment approach by utilizing Kubernetes ConfigMaps.

Preparing the Database

Create the wordpress database and user on the master and assign with correct privilege:

mysql-master> CREATE DATABASE wordpress;
mysql-master> CREATE USER wordpress@'%' IDENTIFIED BY 'passw0rd';
mysql-master> GRANT ALL PRIVILEGES ON wordpress.* TO wordpress@'%';

Also, create the ProxySQL monitoring user:

mysql-master> CREATE USER proxysql@'%' IDENTIFIED BY 'proxysqlpassw0rd';

Then, reload the grant table:

mysql-master> FLUSH PRIVILEGES;

Preparing the Pod

Now, copy paste the following lines into a file called blog-deployment.yml on the host where kubectl is configured:

apiVersion: apps/v1
kind: Deployment
metadata:
  name: blog
  labels:
    app: blog
spec:
  replicas: 1
  selector:
    matchLabels:
      app: blog
      tier: frontend
  strategy:
    type: RollingUpdate
  template:
    metadata:
      labels:
        app: blog
        tier: frontend
    spec:

      restartPolicy: Always

      containers:
      - image: wordpress:4.9-apache
        name: wordpress
        env:
        - name: WORDPRESS_DB_HOST
          value: localhost:/tmp/proxysql.sock
        - name: WORDPRESS_DB_USER
          value: wordpress
        - name: WORDPRESS_DB_PASSWORD
          valueFrom:
            secretKeyRef:
              name: mysql-pass
              key: password
        ports:
        - containerPort: 80
          name: wordpress
        volumeMounts:
        - name: wordpress-persistent-storage
          mountPath: /var/www/html
        - name: shared-data
          mountPath: /tmp

      - image: severalnines/proxysql
        name: proxysql
        volumeMounts:
        - name: proxysql-config
          mountPath: /etc/proxysql.cnf
          subPath: proxysql.cnf
        - name: shared-data
          mountPath: /tmp

      volumes:
      - name: wordpress-persistent-storage
        persistentVolumeClaim:
          claimName: wp-pv-claim
      - name: proxysql-config
        configMap:
          name: proxysql-configmap
      - name: shared-data
        emptyDir: {}

The YAML file has many lines and let's look the interesting part only. The first section:

apiVersion: apps/v1
kind: Deployment

The first line is the apiVersion. Our Kubernetes cluster is running on v1.12 so we should refer to the Kubernetes v1.12 API documentation and follow the resource declaration according to this API. The next one is the kind, which tells what type of resource that we want to deploy. Deployment, Service, ReplicaSet, DaemonSet, PersistentVolume are some of the examples.

The next important section is the "containers" section. Here we define all containers that we would like to run together in this pod. The first part is the Wordpress container:

      - image: wordpress:4.9-apache
        name: wordpress
        env:
        - name: WORDPRESS_DB_HOST
          value: localhost:/tmp/proxysql.sock
        - name: WORDPRESS_DB_USER
          value: wordpress
        - name: WORDPRESS_DB_PASSWORD
          valueFrom:
            secretKeyRef:
              name: mysql-pass
              key: password
        ports:
        - containerPort: 80
          name: wordpress
        volumeMounts:
        - name: wordpress-persistent-storage
          mountPath: /var/www/html
        - name: shared-data
          mountPath: /tmp

In this section, we are telling Kubernetes to deploy Wordpress 4.9 using Apache web server and we gave the container the name "wordpress". We also want Kubernetes to pass a number of environment variables:

  • WORDPRESS_DB_HOST - The database host. Since our ProxySQL container resides in the same Pod with the Wordpress container, it's more secure to use a ProxySQL socket file instead. The format to use socket file in Wordpress is "localhost:{path to the socket file}". By default, it's located under /tmp directory of the ProxySQL container. This /tmp path is shared between Wordpress and ProxySQL containers by using "shared-data" volumeMounts as shown further down. Both containers have to mount this volume to share the same content under /tmp directory.
  • WORDPRESS_DB_USER - Specify the wordpress database user.
  • WORDPRESS_DB_PASSWORD - The password for WORDPRESS_DB_USER. Since we do not want to expose the password in this file, we can hide it using Kubernetes Secrets. Here we instruct Kubernetes to read the "mysql-pass" Secret resource instead. Secrets has to be created in advanced before the pod deployment, as explained further down.

We also want to publish port 80 of the container for the end user. The Wordpress content stored inside /var/www/html in the container will be mounted into our persistent storage running on NFS.

Next, we define the ProxySQL container:

      - image: severalnines/proxysql:1.4.12
        name: proxysql
        volumeMounts:
        - name: proxysql-config
          mountPath: /etc/proxysql.cnf
          subPath: proxysql.cnf
        - name: shared-data
          mountPath: /tmp
        ports:
        - containerPort: 6033
          name: proxysql

In the above section, we are telling Kubernetes to deploy a ProxySQL using severalnines/proxysql image version 1.4.12. We also want Kubernetes to mount our custom, pre-configured configuration file and map it to /etc/proxysql.cnf inside the container. There will be a volume called "shared-data" which map to /tmp directory to share with the Wordpress image - a temporary directory that shares a pod's lifetime. This allows ProxySQL socket file (/tmp/proxysql.sock) to be used by the Wordpress container when connecting to the database, bypassing the TCP/IP networking.

The last part is the "volumes" section:

      volumes:
      - name: wordpress-persistent-storage
        persistentVolumeClaim:
          claimName: wp-pv-claim
      - name: proxysql-config
        configMap:
          name: proxysql-configmap
      - name: shared-data
        emptyDir: {}

Kubernetes will have to create three volumes for this pod:

  • wordpress-persistent-storage - Use the PersistentVolumeClaim resource to map NFS export into the container for persistent data storage for Wordpress content.
  • proxysql-config - Use the ConfigMap resource to map the ProxySQL configuration file.
  • shared-data - Use the emptyDir resource to mount a shared directory for our containers inside the Pod. emptyDir resource is a temporary directory that shares a pod's lifetime.

Therefore, based on our YAML definition above, we have to prepare a number of Kubernetes resources before we can begin to deploy the "blog" pod:

  1. PersistentVolume and PersistentVolumeClaim - To store the web contents of our Wordpress application, so when the pod is being rescheduled to other worker node, we won't lose the last changes.
  2. Secrets - To hide the Wordpress database user password inside the YAML file.
  3. ConfigMap - To map the configuration file to ProxySQL container, so when it's being rescheduled to other node, Kubernetes can automatically remount it again.
Severalnines
 
MySQL on Docker: How to Containerize Your Database
Discover all you need to understand when considering to run a MySQL service on top of Docker container virtualization

PersistentVolume and PersistentVolumeClaim

A good persistent storage for Kubernetes should be accessible by all Kubernetes nodes in the cluster. For the sake of this blog post, we used NFS as the PersistentVolume (PV) provider because it's easy and supported out-of-the-box. The NFS server is located somewhere outside of our Kubernetes network and we have configured it to allow all Kubernetes nodes with the following line inside /etc/exports:

/nfs    192.168.55.*(rw,sync,no_root_squash,no_all_squash)

Take note that NFS client package must be installed on all Kubernetes nodes. Otherwise, Kubernetes wouldn't be able to mount the NFS correctly. On all nodes:

$ sudo apt-install nfs-common #Ubuntu/Debian
$ yum install nfs-utils #RHEL/CentOS

Also, make sure on the NFS server, the target directory exists:

(nfs-server)$ mkdir /nfs/kubernetes/wordpress

Then, create a file called wordpress-pv-pvc.yml and add the following lines:

apiVersion: v1
kind: PersistentVolume
metadata:
  name: wp-pv
  labels:
    app: blog
spec:
  accessModes:
    - ReadWriteOnce
  capacity:
    storage: 3Gi
  mountOptions:
    - hard
    - nfsvers=4.1
  nfs:
    path: /nfs/kubernetes/wordpress
    server: 192.168.55.200
---
kind: PersistentVolumeClaim
apiVersion: v1
metadata:
  name: wp-pvc
spec:
  accessModes:
    - ReadWriteOnce
  resources:
    requests:
      storage: 3Gi
  selector:
    matchLabels:
      app: blog
      tier: frontend

In the above definition, we would like Kubernetes to allocate 3GB of volume space on the NFS server for our Wordpress container. Take note for production usage, NFS should be configured with automatic provisioner and storage class.

Create the PV and PVC resources:

$ kubectl create -f wordpress-pv-pvc.yml

Verify if those resources are created and the status must be "Bound":

$ kubectl get pv,pvc
NAME                     CAPACITY   ACCESS MODES   RECLAIM POLICY   STATUS   CLAIM            STORAGECLASS   REASON   AGE
persistentvolume/wp-pv   3Gi        RWO            Recycle          Bound    default/wp-pvc                           22h

NAME                           STATUS   VOLUME   CAPACITY   ACCESS MODES   STORAGECLASS   AGE
persistentvolumeclaim/wp-pvc   Bound    wp-pv    3Gi        RWO                           22h

Secrets

The first one is to create a secret to be used by the Wordpress container for WORDPRESS_DB_PASSWORD environment variable. The reason is simply because we don't want to expose the password in clear text inside the YAML file.

Create a secret resource called mysql-pass and pass the password accordingly:

$ kubectl create secret generic mysql-pass --from-literal=password=passw0rd

Verify that our secret is created:

$ kubectl get secrets mysql-pass
NAME         TYPE     DATA   AGE
mysql-pass   Opaque   1      7h12m

ConfigMap

We also need to create a ConfigMap resource for our ProxySQL container. A Kubernetes ConfigMap file holds key-value pairs of configuration data that can be consumed in pods or used to store configuration data. ConfigMaps allow you to decouple configuration artifacts from image content to keep containerized applications portable.

Since our database server is already running on bare-metal servers with a static hostname and IP address plus static monitoring username and password, in this use case the ConfigMap file will store pre-configured configuration information about the ProxySQL service that we want to use.

First create a text file called proxysql.cnf and add the following lines:

datadir="/var/lib/proxysql"
admin_variables=
{
        admin_credentials="admin:adminpassw0rd"
        mysql_ifaces="0.0.0.0:6032"
        refresh_interval=2000
}
mysql_variables=
{
        threads=4
        max_connections=2048
        default_query_delay=0
        default_query_timeout=36000000
        have_compress=true
        poll_timeout=2000
        interfaces="0.0.0.0:6033;/tmp/proxysql.sock"
        default_schema="information_schema"
        stacksize=1048576
        server_version="5.1.30"
        connect_timeout_server=10000
        monitor_history=60000
        monitor_connect_interval=200000
        monitor_ping_interval=200000
        ping_interval_server_msec=10000
        ping_timeout_server=200
        commands_stats=true
        sessions_sort=true
        monitor_username="proxysql"
        monitor_password="proxysqlpassw0rd"
}
mysql_servers =
(
        { address="192.168.55.171" , port=3306 , hostgroup=10, max_connections=100 },
        { address="192.168.55.172" , port=3306 , hostgroup=10, max_connections=100 },
        { address="192.168.55.171" , port=3306 , hostgroup=20, max_connections=100 },
        { address="192.168.55.172" , port=3306 , hostgroup=20, max_connections=100 }
)
mysql_users =
(
        { username = "wordpress" , password = "passw0rd" , default_hostgroup = 10 , active = 1 }
)
mysql_query_rules =
(
        {
                rule_id=100
                active=1
                match_pattern="^SELECT .* FOR UPDATE"
                destination_hostgroup=10
                apply=1
        },
        {
                rule_id=200
                active=1
                match_pattern="^SELECT .*"
                destination_hostgroup=20
                apply=1
        },
        {
                rule_id=300
                active=1
                match_pattern=".*"
                destination_hostgroup=10
                apply=1
        }
)
mysql_replication_hostgroups =
(
        { writer_hostgroup=10, reader_hostgroup=20, comment="MySQL Replication 5.7" }
)

Pay extra attention to the "mysql_servers" and "mysql_users" sections, where you might need to modify the values to suit your database cluster setup. In this case, we have two database servers running in MySQL Replication as summarized in the following Topology screenshot taken from ClusterControl:

All writes should go to the master node while reads are forwarded to hostgroup 20, as defined under "mysql_query_rules" section. That's the basic of read/write splitting and we want to utilize them altogether.

Then, import the configuration file into ConfigMap:

$ kubectl create configmap proxysql-configmap --from-file=proxysql.cnf
configmap/proxysql-configmap created

Verify if the ConfigMap is loaded into Kubernetes:

$ kubectl get configmap
NAME                 DATA   AGE
proxysql-configmap   1      45s

Deploying the Pod

Now we should be good to deploy the blog pod. Send the deployment job to Kubernetes:

$ kubectl create -f blog-deployment.yml

Verify the pod status:

$ kubectl get pods
NAME                           READY   STATUS              RESTARTS   AGE
blog-54755cbcb5-t4cb7          2/2     Running             0          100s

It must show 2/2 under the READY column, indicating there are two containers running inside the pod. Use the -c option flag to check the Wordpress and ProxySQL containers inside the blog pod:

$ kubectl logs blog-54755cbcb5-t4cb7 -c wordpress
$ kubectl logs blog-54755cbcb5-t4cb7 -c proxysql

From the ProxySQL container log, you should see the following lines:

2018-10-20 08:57:14 [INFO] Dumping current MySQL Servers structures for hostgroup ALL
HID: 10 , address: 192.168.55.171 , port: 3306 , weight: 1 , status: ONLINE , max_connections: 100 , max_replication_lag: 0 , use_ssl: 0 , max_latency_ms: 0 , comment:
HID: 10 , address: 192.168.55.172 , port: 3306 , weight: 1 , status: OFFLINE_HARD , max_connections: 100 , max_replication_lag: 0 , use_ssl: 0 , max_latency_ms: 0 , comment:
HID: 20 , address: 192.168.55.171 , port: 3306 , weight: 1 , status: ONLINE , max_connections: 100 , max_replication_lag: 0 , use_ssl: 0 , max_latency_ms: 0 , comment:
HID: 20 , address: 192.168.55.172 , port: 3306 , weight: 1 , status: ONLINE , max_connections: 100 , max_replication_lag: 0 , use_ssl: 0 , max_latency_ms: 0 , comment:

HID 10 (writer hostgroup) must have only one ONLINE node (indicating a single master) and the other host must be in at least in OFFLINE_HARD status. For HID 20, it's expected to be ONLINE for all nodes (indicating multiple read replicas).

To get a summary of the deployment, use the describe flag:

$ kubectl describe deployments blog

Our blog is now running, however we can't access it from outside of the Kubernetes network without configuring the service, as explained in the next section.

Creating the Blog Service

The last step is to create attach a service to our pod. This to ensure that our Wordpress blog pod is accessible from the outside world. Create a file called blog-svc.yml and paste the following line:

apiVersion: v1
kind: Service
metadata:
  name: blog
  labels:
    app: blog
    tier: frontend
spec:
  type: NodePort
  ports:
  - name: blog
    nodePort: 30080
    port: 80
  selector:
    app: blog
    tier: frontend

Create the service:

$ kubectl create -f blog-svc.yml

Verify if the service is created correctly:

root@kube1:~/proxysql-blog# kubectl get svc
NAME         TYPE        CLUSTER-IP     EXTERNAL-IP   PORT(S)        AGE
blog         NodePort    10.96.140.37   <none>        80:30080/TCP   26s
kubernetes   ClusterIP   10.96.0.1      <none>        443/TCP        43h

Port 80 published by the blog pod is now mapped to the outside world via port 30080. We can access our blog post at http://{any_kubernetes_host}:30080/ and should be redirected to the Wordpress installation page. If we proceed with the installation, it would skip the database connection part and directly show this page:

It indicates that our MySQL and ProxySQL configuration is correctly configured inside wp-config.php file. Otherwise, you would be redirected to the database configuration page.

Our deployment is now complete.

Managing ProxySQL Container inside a Pod

Failover and recovery are expected to be handled automatically by Kubernetes. For example, if Kubernetes worker goes down, the pod will be recreated in the next available node after --pod-eviction-timeout (default to 5 minutes). If the container crashes or is killed, Kubernetes will replace it almost instantly.

Some common management tasks are expected to be different when running within Kubernetes, as shown in the next sections.

Scaling Up and Down

In the above configuration, we were deploying one replica in our deployment. To scale up, simply change the spec.replicas value accordingly by using kubectl edit command:

$ kubectl edit deployment blog

It will open up the deployment definition in a default text file and simply change the spec.replicas value to something higher, for example, "replicas: 3". Then, save the file and immediately check the rollout status by using the following command:

$ kubectl rollout status deployment blog
Waiting for deployment "blog" rollout to finish: 1 of 3 updated replicas are available...
Waiting for deployment "blog" rollout to finish: 2 of 3 updated replicas are available...
deployment "blog" successfully rolled out

At this point, we have three blog pods (Wordpress + ProxySQL) running simultanouesly in Kubernetes:

$ kubectl get pods
NAME                             READY   STATUS              RESTARTS   AGE
blog-54755cbcb5-6fnqn            2/2     Running             0          11m
blog-54755cbcb5-cwpdj            2/2     Running             0          11m
blog-54755cbcb5-jxtvc            2/2     Running             0          22m

At this point, our architecture is looking something like this:

Take note that it might require more customization than our current configuration to run Wordpress smoothly in a horizontal-scaled production environment (think about static contents, session management and others). Those are actually beyond the scope of this blog post.

Scaling down procedures are similar.

Configuration Management

Configuration management is important in ProxySQL. This is where the magic happens where you can define your own set of query rules to do query caching, firewalling and rewriting. Contrary to the common practice, where ProxySQL would be configured via Admin console and push into persistency by using "SAVE .. TO DISK", we will stick with configuration files only to make things more portable in Kubernetes. That's the reason we are using ConfigMaps.

Since we are relying on our centralized configuration stored by Kubernetes ConfigMaps, there are a number of ways to perform configuration changes. Firstly, by using the kubectl edit command:

$ kubectl edit configmap proxysql-configmap

It will open up the configuration in a default text editor and you can directly make changes to it and save the text file once done. Otherwise, recreate the configmaps should also do:

$ vi proxysql.cnf # edit the configuration first
$ kubectl delete configmap proxysql-configmap
$ kubectl create configmap proxysql-configmap --from-file=proxysql.cnf

After the configuration is pushed into ConfigMap, restart the pod or container as shown in the Service Control section. Configuring the container via ProxySQL admin interface (port 6032) won't make it persistent after pod rescheduling by Kubernetes.

Service Control

Since the two containers inside a pod are tightly coupled, the best way to apply the ProxySQL configuration changes is to force Kubernetes to do pod replacement. Consider we are having three blog pods now after we scaled up:

$ kubectl get pods
NAME                             READY   STATUS              RESTARTS   AGE
blog-54755cbcb5-6fnqn            2/2     Running             0          31m
blog-54755cbcb5-cwpdj            2/2     Running             0          31m
blog-54755cbcb5-jxtvc            2/2     Running             1          22m

Use the following command to replace one pod at a time:

$ kubectl get pod blog-54755cbcb5-6fnqn -n default -o yaml | kubectl replace --force -f -
pod "blog-54755cbcb5-6fnqn" deleted
pod/blog-54755cbcb5-6fnqn

Then, verify with the following:

$ kubectl get pods
NAME                             READY   STATUS              RESTARTS   AGE
blog-54755cbcb5-6fnqn            2/2     Running             0          31m
blog-54755cbcb5-cwpdj            2/2     Running             0          31m
blog-54755cbcb5-qs6jm            2/2     Running             1          2m26s

You will notice the most recent pod has been restarted by looking at the AGE and RESTART column, it came up with a different pod name. Repeat the same steps for the remaining pods. Otherwise, you can also use "docker kill" command to kill the ProxySQL container manually inside the Kubernetes worker node. For example:

(kube-worker)$ docker kill $(docker ps | grep -i proxysql_blog | awk {'print $1'})

Kubernetes will then replace the killed ProxySQL container with a new one.

Monitoring

Use kubectl exec command to execute SQL statement via mysql client. For example, to monitor query digestion:

$ kubectl exec -it blog-54755cbcb5-29hqt -c proxysql -- mysql -uadmin -p -h127.0.0.1 -P6032
mysql> SELECT * FROM stats_mysql_query_digest;

Or with a one-liner:

$ kubectl exec -it blog-54755cbcb5-29hqt -c proxysql -- mysql -uadmin -p -h127.0.0.1 -P6032 -e 'SELECT * FROM stats_mysql_query_digest'

By changing the SQL statement, you can monitor other ProxySQL components or perform any administration tasks via this Admin console. Again, it will only persist during the ProxySQL container lifetime and won't get persisted if the pod is rescheduled.

Final Thoughts

ProxySQL holds a key role if you want to scale your application containers and and have an intelligent way to access a distributed database backend. There are a number of ways to deploy ProxySQL on Kubernetes to support our application growth when running at scale. This blog post only covers one of them.

In an upcoming blog post, we are going to look at how to run ProxySQL in a centralized approach by using it as a Kubernetes service.

Webinar: Backup Management for MySQL, MariaDB, PostgreSQL & MongoDB with ClusterControl

$
0
0

Are you frustrated with traditional, labour-intensive backup and archive practices for your MySQL, MariaDB, MongoDB and PostgreSQL databases?

What if you could have one backup management solution for all your business data? What if you could ensure integrity of all your backups? And what if you could leverage the competitive pricing and almost limitless capacity of cloud-based backup while meeting cost, manageability, and compliance requirements from the business?

Welcome to our webinar on Backup Management with ClusterControl on November 13th 2018.

Whether you are looking at rebuilding your existing backup infrastructure, or updating it, this webinar is for you.

ClusterControl’s centralized backup management for open source databases provides you with hot backups of large datasets, point in time recovery in a couple of clicks, at-rest and in-transit data encryption, data integrity via automatic restore verification, cloud backups (AWS, Google and Azure) for Disaster Recovery, retention policies to ensure compliance, and automated alerts and reporting.

Date, Time & Registration

Europe/MEA/APAC

Tuesday, November 13th at 09:00 GMT / 10:00 CET (Germany, France, Sweden)

Register Now

North America/LatAm

Tuesday, November 13th at 09:00 PST (US) / 12:00 EST (US)

Register Now

Agenda

  • Backup and recovery management of local or remote databases
    • Logical or physical backups
    • Full or Incremental backups
    • Position or time-based Point in Time Recovery (for MySQL and PostgreSQL)
    • Upload to the cloud (Amazon S3, Google Cloud Storage, Azure Storage)
    • Encryption of backup data
    • Compression of backup data
  • One centralized backup system for your open source databases (Demo)
    • Schedule, manage and operate backups
    • Define backup policies, retention, history
    • Validation - Automatic restore verification
    • Backup reporting

Speaker

Bartlomiej Oles is a MySQL and Oracle DBA, with over 15 years experience in managing highly available production systems at IBM, Nordea Bank, Acxiom, Lufthansa, and other Fortune 500 companies. In the past five years, his focus has been on building and applying automation tools to manage multi-datacenter database environments.

Effective Monitoring of MySQL Replication with SCUMM Dashboards - Part 2

$
0
0

In our previous blog on SCUMM dashboards, we looked at the MySQL overview dashboard. The new version of ClusterControl (ver. 1.7) offers a number of high resolution graphs of useful metrics, and we went through the meaning of each of the metrics, and how they help you troubleshoot your database. In this blog, we will look at the MySQL Replication dashboard. Let’s proceed on the details of this dashboard on what has to offer.

MySQL Replication Dashboard

The MySQL Replication Dashboard offers a very straightforward sets of graph that makes it easier to monitor your MySQL master and replica(s). Starting from the top, it shows the most important variables and information to determine the health of the replica(s) or even the master. This dashboard offers a very useful part when inspecting the health of the slaves or a master in master-master setup. One can as well check on this dashboard the master’s binary log creation and determine the overall dimension, in terms of the generated size, at a particular given period of time.

First thing in this dashboard, it presents you with the most important information you might need with the health of your replica. See the graph below:

Basically, it will show you the Slave thread’s IO_Thread, SQL_Thread, replication error and if has read_only variable enabled. From the sample screenshot above, all the information shows that my slave 192.168.70.20 is healthy and running normally.

Additionally, ClusterControl has information to gather as well if you go over to Cluster -> Overview. Scroll down and you can see the graph below:

Another place to view the replication setup is the topology view of the replication setup, accessible at Cluster -> Topology. It gives, at a quick glance, a view of the different nodes in the setup, their roles, replication lag, retrieved GTID and more. See the graph below:

In addition to this, the Topology View also shows all the different nodes that form part of your database cluster whether its the database nodes, load balancers (ProxySQL/MaxScale/HaProxy) or arbitrators (garbd), as well as the connections between them. The nodes, connections, and their statuses are discovered by ClusterControl. Since ClusterControl is continuously monitoring the nodes and keeps state information, any changes in the topology are reflected in the web interface. In case of failure of nodes are reported, you can use the this view along with the SCUMM Dashboards and see what impact that might have cause it.

The Topology View has some similarity with Orchestrator in which you can manage the nodes, change masters by dragging and dropping the object on the desired master, restart nodes and synchronize data. To know more about our Topology View, we suggest you to read our previous blog - “Visualizing your Cluster Topology in ClusterControl”.

Let’s now proceed with the graphs.

  • MySQL Replication Delay
    This graph is very familiar to anybody managing MySQL, especially those who are working on a daily basis on their master-slave setup. This graph has the trends for all the lags recorded for a specific time range specified in this dashboard. Whenever we want to check the periodic fall time that our replica has, then this graph is good to look at. There are certain occasions that a replica could lag for odd reasons like your RAID has a degraded BBU and needs a replacement, a table has no unique key but not on the master, an unwanted full table scan or full index scan, or a bad query was left running by a developer. This is also a good indicator to determine if slave lag is a key issue, then you may want to take advantage of parallel replication.

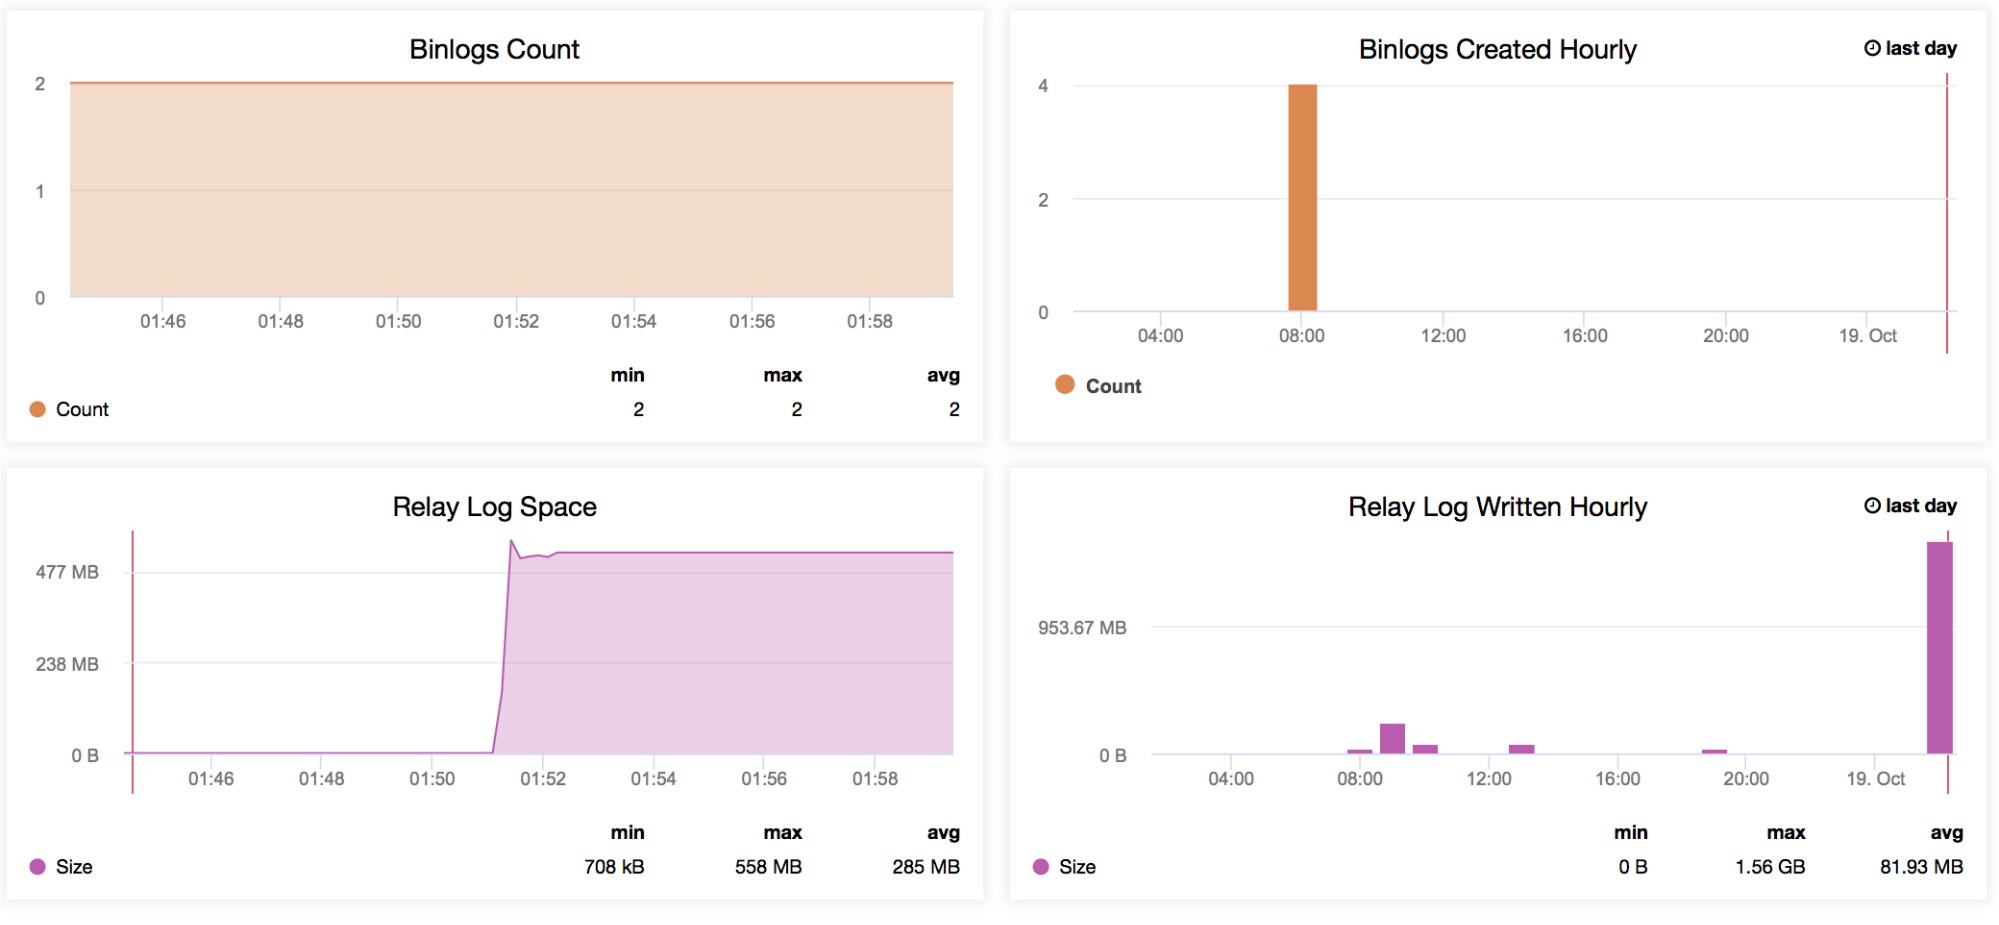
  • Binlog Size
    These graphs are related to each other. The Binlog Size graph shows you how your node generates the binary log and helps determine its dimension based on the period of time you are scanning.

  • Binlog Data Written Hourly
    The Binlog Data Written Hourly is a graph based on the current day and the previous day recorded. This might be useful whenever you want to identify how large your node is that is accepting writes, which you can later use for capacity planning.

  • Binlogs Count
    Let’s say you expect high traffic for a given week. You want to compare how large writes are going through your master and slaves with the previous week. This graph is very useful for this kind of situation - To determine how high the generated binary logs were on the master itself or even on the slaves if log_slave_updates variable is enabled. You may also use this indicator to determine your master vs slaves binary log data generated, especially if you are filtering some tables or schemas (replicate_ignore_db, replicate_ignore_table, replicate_wild_do_table) on your slaves that were generated while log_slave_updates is enabled.

  • Binlogs Created Hourly
    This graph is a quick overview to compare your binlogs creation hourly from yesterday and today’s date.

  • Relay Log Space
    This graph serves as the basis of the generated relay logs from your replica. When used along with the MySQL Replication Delay graph, it helps determine how large the number of relay logs generated is, which the administrator has to consider in terms of disk availability of the current replica. It can cause trouble when your slave is rigorously lagging, and is generating large numbers of relay logs. This can consume your disk space quickly. There are certain situations that, due to a high number of writes from the master, the slave/replica will lag tremendously, thus generating a large amount of logs can cause some serious problems on that replica. This can help the ops team when talking to their management about capacity planning.

  • Relay Log Written Hourly
    Same as the Relay Log Space but adds a quick overview to compare your relay logs written from yesterday and today’s date.

Conclusion

You learned that using SCUMM to monitor your MySQL Replication adds more productivity and efficiency to the operations team. Using the features we have from previous versions combined with the graphs provided with SCUMM is like going to the gym and seeing massive improvements in your productivity. This is what SCUMM can offer: monitoring on steroids! (now, we are not advocating that you should take steroids when going to the gym!)

In Part 3 of this blog, I will discuss the InnoDB Metrics and MySQL Performance Schema Dashboards.

MySQL on Docker: Running ProxySQL as Kubernetes Service

$
0
0

When running distributed database clusters, it is quite common to front them with load balancers. The advantages are clear - load balancing, connection failover and decoupling of the application tier from the underlying database topologies. For more intelligent load balancing, a database-aware proxy like ProxySQL or MaxScale would be the way to go. In our previous blog, we showed you how to run ProxySQL as a helper container in Kubernetes. In this blog post, we’ll show you how to deploy ProxySQL as a Kubernetes service. We’ll use Wordpress as an example application and the database backend is running on a two-node MySQL Replication deployed using ClusterControl. The following diagram illustrates our infrastructure:
Since we are going to deploy a similar setup as in this previous blog post, do expect duplication in some parts of the blog post to keep the post more readable.

ProxySQL on Kubernetes

Let’s start with a bit of recap. Designing a ProxySQL architecture is a subjective topic and highly dependent on the placement of the application, database containers as well as the role of ProxySQL itself. Ideally, we can configure ProxySQL to be managed by Kubernetes with two configurations:

  1. ProxySQL as a Kubernetes service (centralized deployment)
  2. ProxySQL as a helper container in a pod (distributed deployment)

Both deployments can be distinguished easily by looking at the following diagram:

This blog post will cover the first configuration - running ProxySQL as a Kubernetes service. The second configuration is already covered here. In contrast to the helper container approach, running as a service makes ProxySQL pods live independently from the applications and can be easily scaled and clustered together with the help of Kubernetes ConfigMap. This is definitely a different clustering approach than ProxySQL native clustering support which relies on configuration checksum across ProxySQL instances (a.k.a proxysql_servers). Check out this blog post if you want to learn about ProxySQL clustering made easy with ClusterControl.
In Kubernetes, ProxySQL's multi-layer configuration system makes pod clustering possible with ConfigMap. However, there are a number of shortcomings and workarounds to make it work smoothly as what ProxySQL's native clustering feature does. At the moment, signalling a pod upon ConfigMap update is a feature in the works. We will cover this topic in much greater detail in an upcoming blog post.

Basically, we need to create ProxySQL pods and attach a Kubernetes service to be accessed by the other pods within the Kubernetes network or externally. Applications will then connect to the ProxySQL service via TCP/IP networking on the configured ports. Default to 6033 for MySQL load-balanced connections and 6032 for ProxySQL administration console. With more than one replica, the connections to the pod will be load balanced automatically by Kubernetes kube-proxy component running on every Kubernetes node.

ProxySQL as Kubernetes Service

In this setup, we run both ProxySQL and Wordpress as pods and services. The following diagram illustrates our high-level architecture:

In this setup, we will deploy two pods and services - "wordpress" and "proxysql". We will merge Deployment and Service declaration in one YAML file per application and manage them as one unit. To keep the application containers' content persistent across multiple nodes, we have to use a clustered or remote file system, which in this case is NFS.

Deploying ProxySQL as a service brings a couple of good things over the helper container approach:

  • Using Kubernetes ConfigMap approach, ProxySQL can be clustered with immutable configuration.
  • Kubernetes handles ProxySQL recovery and balance the connections to the instances automatically.
  • Single endpoint with Kubernetes Virtual IP address implementation called ClusterIP.
  • Centralized reverse proxy tier with shared nothing architecture.
  • Can be used with external applications outside Kubernetes.

We will start the deployment as two replicas for ProxySQL and three for Wordpress to demonstrate running at scale and load-balancing capabilities that Kubernetes offers.

Preparing the Database

Create the wordpress database and user on the master and assign with correct privilege:

mysql-master> CREATE DATABASE wordpress;
mysql-master> CREATE USER wordpress@'%' IDENTIFIED BY 'passw0rd';
mysql-master> GRANT ALL PRIVILEGES ON wordpress.* TO wordpress@'%';

Also, create the ProxySQL monitoring user:

mysql-master> CREATE USER proxysql@'%' IDENTIFIED BY 'proxysqlpassw0rd';

Then, reload the grant table:

mysql-master> FLUSH PRIVILEGES;

ProxySQL Pod and Service Definition

The next one is to prepare our ProxySQL deployment. Create a file called proxysql-rs-svc.yml and add the following lines:

apiVersion: v1
kind: Deployment
metadata:
  name: proxysql
  labels:
    app: proxysql
spec:
  replicas: 2
  selector:
    matchLabels:
      app: proxysql
      tier: frontend
  strategy:
    type: RollingUpdate
  template:
    metadata:
      labels:
        app: proxysql
        tier: frontend
    spec:
      restartPolicy: Always
      containers:
      - image: severalnines/proxysql:1.4.12
        name: proxysql
        volumeMounts:
        - name: proxysql-config
          mountPath: /etc/proxysql.cnf
          subPath: proxysql.cnf
        ports:
        - containerPort: 6033
          name: proxysql-mysql
        - containerPort: 6032
          name: proxysql-admin
      volumes:
      - name: proxysql-config
        configMap:
          name: proxysql-configmap
---
apiVersion: v1
kind: Service
metadata:
  name: proxysql
  labels:
    app: proxysql
    tier: frontend
spec:
  type: NodePort
  ports:
  - nodePort: 30033
    port: 6033
    name: proxysql-mysql
  - nodePort: 30032
    port: 6032
    name: proxysql-admin
  selector:
    app: proxysql
    tier: frontend

Let's see what those definitions are all about. The YAML consists of two resources combined in a file, separated by "---" delimiter. The first resource is the Deployment, which we define the following specification:

spec:
  replicas: 2
  selector:
    matchLabels:
      app: proxysql
      tier: frontend
  strategy:
    type: RollingUpdate

The above means we would like to deploy two ProxySQL pods as a ReplicaSet that matches containers labelled with "app=proxysql,tier=frontend". The deployment strategy specifies the strategy used to replace old pods by new ones. In this deployment, we picked RollingUpdate which means the pods will be updated in a rolling update fashion, one pod at a time.

The next part is the container's template:

      - image: severalnines/proxysql:1.4.12
        name: proxysql
        volumeMounts:
        - name: proxysql-config
          mountPath: /etc/proxysql.cnf
          subPath: proxysql.cnf
        ports:
        - containerPort: 6033
          name: proxysql-mysql
        - containerPort: 6032
          name: proxysql-admin
      volumes:
      - name: proxysql-config
        configMap:
          name: proxysql-configmap

In the spec.templates.spec.containers.* section, we are telling Kubernetes to deploy ProxySQL using severalnines/proxysql image version 1.4.12. We also want Kubernetes to mount our custom, pre-configured configuration file and map it to /etc/proxysql.cnf inside the container. The running pods will publish two ports - 6033 and 6032. We also define the "volumes" section, where we instruct Kubernetes to mount the ConfigMap as a volume inside the ProxySQL pods to be mounted by volumeMounts.

The second resource is the service. A Kubernetes service is an abstraction layer which defines the logical set of pods and a policy by which to access them. In this section, we define the following:

apiVersion: v1
kind: Service
metadata:
  name: proxysql
  labels:
    app: proxysql
    tier: frontend
spec:
  type: NodePort
  ports:
  - nodePort: 30033
    port: 6033
    name: proxysql-mysql
  - nodePort: 30032
    port: 6032
    name: proxysql-admin
  selector:
    app: proxysql
    tier: frontend

In this case, we want our ProxySQL to be accessed from the external network thus NodePort type is the chosen type. This will publish the nodePort on every Kubernetes nodes in the cluster. The range of valid ports for NodePort resource is 30000-32767. We chose port 30033 for MySQL-load balanced connections which is mapped to port 6033 of the ProxySQL pods and port 30032 for ProxySQL Administration port mapped to 6032.

Therefore, based on our YAML definition above, we have to prepare the following Kubernetes resource before we can begin to deploy the "proxysql" pod:

  • ConfigMap - To store ProxySQL configuration file as a volume so it can be mounted to multiple pods and can be remounted again if the pod is being rescheduled to the other Kubernetes node.

Preparing ConfigMap for ProxySQL

Similar to the previous blog post, we are going to use ConfigMap approach to decouple the configuration file from the container and also for scalability purpose. Take note that in this setup, we consider our ProxySQL configuration is immutable.

Firstly, create the ProxySQL configuration file, proxysql.cnf and add the following lines:

datadir="/var/lib/proxysql"
admin_variables=
{
        admin_credentials="proxysql-admin:adminpassw0rd"
        mysql_ifaces="0.0.0.0:6032"
        refresh_interval=2000
}
mysql_variables=
{
        threads=4
        max_connections=2048
        default_query_delay=0
        default_query_timeout=36000000
        have_compress=true
        poll_timeout=2000
        interfaces="0.0.0.0:6033;/tmp/proxysql.sock"
        default_schema="information_schema"
        stacksize=1048576
        server_version="5.1.30"
        connect_timeout_server=10000
        monitor_history=60000
        monitor_connect_interval=200000
        monitor_ping_interval=200000
        ping_interval_server_msec=10000
        ping_timeout_server=200
        commands_stats=true
        sessions_sort=true
        monitor_username="proxysql"
        monitor_password="proxysqlpassw0rd"
}
mysql_replication_hostgroups =
(
        { writer_hostgroup=10, reader_hostgroup=20, comment="MySQL Replication 5.7" }
)
mysql_servers =
(
        { address="192.168.55.171" , port=3306 , hostgroup=10, max_connections=100 },
        { address="192.168.55.172" , port=3306 , hostgroup=10, max_connections=100 },
        { address="192.168.55.171" , port=3306 , hostgroup=20, max_connections=100 },
        { address="192.168.55.172" , port=3306 , hostgroup=20, max_connections=100 }
)
mysql_users =
(
        { username = "wordpress" , password = "passw0rd" , default_hostgroup = 10 , active = 1 }
)
mysql_query_rules =
(
        {
                rule_id=100
                active=1
                match_pattern="^SELECT .* FOR UPDATE"
                destination_hostgroup=10
                apply=1
        },
        {
                rule_id=200
                active=1
                match_pattern="^SELECT .*"
                destination_hostgroup=20
                apply=1
        },
        {
                rule_id=300
                active=1
                match_pattern=".*"
                destination_hostgroup=10
                apply=1
        }
)

Pay attention on the admin_variables.admin_credentials variable where we used non-default user which is "proxysql-admin". ProxySQL reserves the default "admin" user for local connection via localhost only. Therefore, we have to use other users to access the ProxySQL instance remotely. Otherwise, you would get the following error:

ERROR 1040 (42000): User 'admin' can only connect locally

Our ProxySQL configuration is based on our two database servers running in MySQL Replication as summarized in the following Topology screenshot taken from ClusterControl:

All writes should go to the master node while reads are forwarded to hostgroup 20, as defined under "mysql_query_rules" section. That's the basic of read/write splitting and we want to utilize them altogether.

Then, import the configuration file into ConfigMap:

$ kubectl create configmap proxysql-configmap --from-file=proxysql.cnf
configmap/proxysql-configmap created

Verify if the ConfigMap is loaded into Kubernetes:

$ kubectl get configmap
NAME                 DATA   AGE
proxysql-configmap   1      45s

Wordpress Pod and Service Definition

Now, paste the following lines into a file called wordpress-rs-svc.yml on the host where kubectl is configured:

apiVersion: apps/v1
kind: Deployment
metadata:
  name: wordpress
  labels:
    app: wordpress
spec:
  replicas: 3
  selector:
    matchLabels:
      app: wordpress
      tier: frontend
  strategy:
    type: RollingUpdate
  template:
    metadata:
      labels:
        app: wordpress
        tier: frontend
    spec:
      restartPolicy: Always
      containers:
      - image: wordpress:4.9-apache
        name: wordpress
        env:
        - name: WORDPRESS_DB_HOST
          value: proxysql:6033 # proxysql.default.svc.cluster.local:6033
        - name: WORDPRESS_DB_USER
          value: wordpress
        - name: WORDPRESS_DB_DATABASE
          value: wordpress
        - name: WORDPRESS_DB_PASSWORD
          valueFrom:
            secretKeyRef:
              name: mysql-pass
              key: password
        ports:
        - containerPort: 80
          name: wordpress
---
apiVersion: v1
kind: Service
metadata:
  name: wordpress
  labels:
    app: wordpress
    tier: frontend
spec:
  type: NodePort
  ports:
  - name: wordpress
    nodePort: 30088
    port: 80
  selector:
    app: wordpress
    tier: frontend

Similar to our ProxySQL definition, the YAML consists of two resources, separated by "---" delimiter combined in a file. The first one is the Deployment resource, which will be deployed as a ReplicaSet, as shown under the "spec.*" section:

spec:
  replicas: 3
  selector:
    matchLabels:
      app: wordpress
      tier: frontend
  strategy:
    type: RollingUpdate

This section provides the Deployment specification - 3 pods to start that matches label "app=wordpress,tier=backend". The deployment strategy is RollingUpdate which means the way Kubernetes will replace the pod is by using rolling update fashion, same with our ProxySQL deployment.

The next part is the "spec.template.spec.*" section:

      restartPolicy: Always
      containers:
      - image: wordpress:4.9-apache
        name: wordpress
        env:
        - name: WORDPRESS_DB_HOST
          value: proxysql:6033
        - name: WORDPRESS_DB_USER
          value: wordpress
        - name: WORDPRESS_DB_PASSWORD
          valueFrom:
            secretKeyRef:
              name: mysql-pass
              key: password
        ports:
        - containerPort: 80
          name: wordpress
        volumeMounts:
        - name: wordpress-persistent-storage
          mountPath: /var/www/html


In this section, we are telling Kubernetes to deploy Wordpress 4.9 using Apache web server and we gave the container the name "wordpress". The container will be restarted every time it is down, regardless of the status. We also want Kubernetes to pass a number of environment variables:

  • WORDPRESS_DB_HOST - The MySQL database host. Since we are using ProxySQL as a service, the service name will be the value of metadata.name which is "proxysql". ProxySQL listens on port 6033 for MySQL load balanced connections while ProxySQL administration console is on 6032.
  • WORDPRESS_DB_USER - Specify the wordpress database user that have been created under "Preparing the Database" section.
  • WORDPRESS_DB_PASSWORD - The password for WORDPRESS_DB_USER. Since we do not want to expose the password in this file, we can hide it using Kubernetes Secrets. Here we instruct Kubernetes to read the "mysql-pass" Secret resource instead. Secrets has to be created in advanced before the pod deployment, as explained further down.

We also want to publish port 80 of the pod for the end user. The Wordpress content stored inside /var/www/html in the container will be mounted into our persistent storage running on NFS. We will use the PersistentVolume and PersistentVolumeClaim resources for this purpose as shown under "Preparing Persistent Storage for Wordpress" section.

After the "---" break line, we define another resource called Service:

apiVersion: v1
kind: Service
metadata:
  name: wordpress
  labels:
    app: wordpress
    tier: frontend
spec:
  type: NodePort
  ports:
  - name: wordpress
    nodePort: 30088
    port: 80
  selector:
    app: wordpress
    tier: frontend

In this configuration, we would like Kubernetes to create a service called "wordpress", listen on port 30088 on all nodes (a.k.a. NodePort) to the external network and forward it to port 80 on all pods labelled with "app=wordpress,tier=frontend".

Therefore, based on our YAML definition above, we have to prepare a number of Kubernetes resources before we can begin to deploy the "wordpress" pod and service:

  • PersistentVolume and PersistentVolumeClaim - To store the web contents of our Wordpress application, so when the pod is being rescheduled to other worker node, we won't lose the last changes.
  • Secrets - To hide the Wordpress database user password inside the YAML file.

Preparing Persistent Storage for Wordpress

A good persistent storage for Kubernetes should be accessible by all Kubernetes nodes in the cluster. For the sake of this blog post, we used NFS as the PersistentVolume (PV) provider because it's easy and supported out-of-the-box. The NFS server is located somewhere outside of our Kubernetes network (as shown in the first architecture diagram) and we have configured it to allow all Kubernetes nodes with the following line inside /etc/exports:

/nfs    192.168.55.*(rw,sync,no_root_squash,no_all_squash)

Take note that NFS client package must be installed on all Kubernetes nodes. Otherwise, Kubernetes wouldn't be able to mount the NFS correctly. On all nodes:

$ sudo apt-install nfs-common #Ubuntu/Debian
$ yum install nfs-utils #RHEL/CentOS

Also, make sure on the NFS server, the target directory exists:

(nfs-server)$ mkdir /nfs/kubernetes/wordpress

Then, create a file called wordpress-pv-pvc.yml and add the following lines:

apiVersion: v1
kind: PersistentVolume
metadata:
  name: wp-pv
  labels:
    app: wordpress
spec:
  accessModes:
    - ReadWriteOnce
  capacity:
    storage: 3Gi
  mountOptions:
    - hard
    - nfsvers=4.1
  nfs:
    path: /nfs/kubernetes/wordpress
    server: 192.168.55.200
---
kind: PersistentVolumeClaim
apiVersion: v1
metadata:
  name: wp-pvc
spec:
  accessModes:
    - ReadWriteOnce
  resources:
    requests:
      storage: 3Gi
  selector:
    matchLabels:
      app: wordpress
      tier: frontend

In the above definition, we are telling Kubernetes to allocate 3GB of volume space on the NFS server for our Wordpress container. Take note for production usage, NFS should be configured with automatic provisioner and storage class.

Create the PV and PVC resources:

$ kubectl create -f wordpress-pv-pvc.yml

Verify if those resources are created and the status must be "Bound":

$ kubectl get pv,pvc
NAME                     CAPACITY   ACCESS MODES   RECLAIM POLICY   STATUS   CLAIM            STORAGECLASS   REASON   AGE
persistentvolume/wp-pv   3Gi        RWO            Recycle          Bound    default/wp-pvc                           22h


NAME                           STATUS   VOLUME   CAPACITY   ACCESS MODES   STORAGECLASS   AGE
persistentvolumeclaim/wp-pvc   Bound    wp-pv    3Gi        RWO                           22h

Preparing Secrets for Wordpress

Create a secret to be used by the Wordpress container for WORDPRESS_DB_PASSWORD environment variable. The reason is simply because we don't want to expose the password in clear text inside the YAML file.

Create a secret resource called mysql-pass and pass the password accordingly:

$ kubectl create secret generic mysql-pass --from-literal=password=passw0rd

Verify that our secret is created:

$ kubectl get secrets mysql-pass
NAME         TYPE     DATA   AGE
mysql-pass   Opaque   1      7h12m

Deploying ProxySQL and Wordpress

Finally, we can begin the deployment. Deploy ProxySQL first, followed by Wordpress:

$ kubectl create -f proxysql-rs-svc.yml
$ kubectl create -f wordpress-rs-svc.yml

We can then list out all pods and services that have been created under "frontend" tier:

$ kubectl get pods,services -l tier=frontend -o wide
NAME                             READY   STATUS    RESTARTS   AGE   IP          NODE          NOMINATED NODE
pod/proxysql-95b8d8446-qfbf2     1/1     Running   0          12m   10.36.0.2   kube2.local   <none>
pod/proxysql-95b8d8446-vljlr     1/1     Running   0          12m   10.44.0.6   kube3.local   <none>
pod/wordpress-59489d57b9-4dzvk   1/1     Running   0          37m   10.36.0.1   kube2.local   <none>
pod/wordpress-59489d57b9-7d2jb   1/1     Running   0          30m   10.44.0.4   kube3.local   <none>
pod/wordpress-59489d57b9-gw4p9   1/1     Running   0          30m   10.36.0.3   kube2.local   <none>

NAME                TYPE       CLUSTER-IP       EXTERNAL-IP   PORT(S)                         AGE   SELECTOR
service/proxysql    NodePort   10.108.195.54    <none>        6033:30033/TCP,6032:30032/TCP   10m   app=proxysql,tier=frontend
service/wordpress   NodePort   10.109.144.234   <none>        80:30088/TCP                    37m   app=wordpress,tier=frontend
  kube2.local   <none>

The above output verifies our deployment architecture where we are currently having three Wordpress pods, exposed on port 30088 publicly as well as our ProxySQL instance which is exposed on port 30033 and 30032 externally plus 6033 and 6032 internally.

At this point, our architecture is looking something like this:

Port 80 published by the Wordpress pods is now mapped to the outside world via port 30088. We can access our blog post at http://{any_kubernetes_host}:30088/ and should be redirected to the Wordpress installation page. If we proceed with the installation, it would skip the database connection part and directly show this page:

It indicates that our MySQL and ProxySQL configuration is correctly configured inside wp-config.php file. Otherwise, you would be redirected to the database configuration page.

Our deployment is now complete.

ProxySQL Pods and Service Management

Failover and recovery are expected to be handled automatically by Kubernetes. For example, if a Kubernetes worker goes down, the pod will be recreated in the next available node after --pod-eviction-timeout (default to 5 minutes). If the container crashes or is killed, Kubernetes will replace it almost instantly.

Some common management tasks are expected to be different when running within Kubernetes, as shown in the next sections.

Connecting to ProxySQL

While ProxySQL is exposed externally on port 30033 (MySQL) and 30032 (Admin), it is also accessible internally via the published ports, 6033 and 6032 respectively. Thus, to access the ProxySQL instances within the Kubernetes network, use the CLUSTER-IP, or the service name "proxysql" as the host value. For example, within Wordpress pod, you may access the ProxySQL admin console by using the following command:

$ mysql -uproxysql-admin -p -hproxysql -P6032

If you want to connect externally, use the port defined under nodePort value he service YAML and pick any of the Kubernetes node as the host value:

$ mysql -uproxysql-admin -p -hkube3.local -P30032

The same applies to the MySQL load-balanced connection on port 30033 (external) and 6033 (internal).

Scaling Up and Down

Scaling up is easy with Kubernetes:

$ kubectl scale deployment proxysql --replicas=5
deployment.extensions/proxysql scaled

Verify the rollout status:

$ kubectl rollout status deployment proxysql
deployment "proxysql" successfully rolled out

Scaling down is also similar. Here we want to revert back from 5 to 2 replicas:

$ kubectl scale deployment proxysql --replicas=2
deployment.extensions/proxysql scaled

We can also look at the deployment events for ProxySQL to get a better picture of what has happened for this deployment by using the "describe" option:

$ kubectl describe deployment proxysql
...
Events:
  Type    Reason             Age    From                   Message
  ----    ------             ----   ----                   -------
  Normal  ScalingReplicaSet  20m    deployment-controller  Scaled up replica set proxysql-769895fbf7 to 1
  Normal  ScalingReplicaSet  20m    deployment-controller  Scaled down replica set proxysql-95b8d8446 to 1
  Normal  ScalingReplicaSet  20m    deployment-controller  Scaled up replica set proxysql-769895fbf7 to 2
  Normal  ScalingReplicaSet  20m    deployment-controller  Scaled down replica set proxysql-95b8d8446 to 0
  Normal  ScalingReplicaSet  7m10s  deployment-controller  Scaled up replica set proxysql-6c55f647cb to 1
  Normal  ScalingReplicaSet  7m     deployment-controller  Scaled down replica set proxysql-769895fbf7 to 1
  Normal  ScalingReplicaSet  7m     deployment-controller  Scaled up replica set proxysql-6c55f647cb to 2
  Normal  ScalingReplicaSet  6m53s  deployment-controller  Scaled down replica set proxysql-769895fbf7 to 0
  Normal  ScalingReplicaSet  54s    deployment-controller  Scaled up replica set proxysql-6c55f647cb to 5
  Normal  ScalingReplicaSet  21s    deployment-controller  Scaled down replica set proxysql-6c55f647cb to 2

The connections to the pods will be load balanced automatically by Kubernetes.

Configuration Changes

One way to make configuration changes on our ProxySQL pods is by versioning our configuration using another ConfigMap name. Firstly, modify our configuration file directly via your favourite text editor:

$ vim /root/proxysql.cnf

Then, load it up into Kubernetes ConfigMap with a different name. In this example, we append "-v2" in the resource name:

$ kubectl create configmap proxysql-configmap-v2 --from-file=proxysql.cnf

Verify if the ConfigMap is loaded correctly:

$ kubectl get configmap
NAME                    DATA   AGE
proxysql-configmap      1      3d15h
proxysql-configmap-v2   1      19m

Open the ProxySQL deployment file, proxysql-rs-svc.yml and change the following line under configMap section to the new version:

      volumes:
      - name: proxysql-config
        configMap:
          name: proxysql-configmap-v2 #change this line

Then, apply the changes to our ProxySQL deployment:

$ kubectl apply -f proxysql-rs-svc.yml
deployment.apps/proxysql configured
service/proxysql configured

Verify the rollout by using looking at the ReplicaSet event using the "describe" flag:

$ kubectl describe proxysql
...
Pod Template:
  Labels:  app=proxysql
           tier=frontend
  Containers:
   proxysql:
    Image:        severalnines/proxysql:1.4.12
    Ports:        6033/TCP, 6032/TCP
    Host Ports:   0/TCP, 0/TCP
    Environment:  <none>
    Mounts:
      /etc/proxysql.cnf from proxysql-config (rw)
  Volumes:
   proxysql-config:
    Type:      ConfigMap (a volume populated by a ConfigMap)
    Name:      proxysql-configmap-v2
    Optional:  false
Conditions:
  Type           Status  Reason
  ----           ------  ------
  Available      True    MinimumReplicasAvailable
  Progressing    True    NewReplicaSetAvailable
OldReplicaSets:  <none>
NewReplicaSet:   proxysql-769895fbf7 (2/2 replicas created)
Events:
  Type    Reason             Age   From                   Message
  ----    ------             ----  ----                   -------
  Normal  ScalingReplicaSet  53s   deployment-controller  Scaled up replica set proxysql-769895fbf7 to 1
  Normal  ScalingReplicaSet  46s   deployment-controller  Scaled down replica set proxysql-95b8d8446 to 1
  Normal  ScalingReplicaSet  46s   deployment-controller  Scaled up replica set proxysql-769895fbf7 to 2
  Normal  ScalingReplicaSet  41s   deployment-controller  Scaled down replica set proxysql-95b8d8446 to 0

Pay attention on the "Volumes" section with the new ConfigMap name. You can also see the deployment events at the bottom of the output. At this point, our new configuration has been loaded into all ProxySQL pods, where Kubernetes scaled down the ProxySQL ReplicaSet to 0 (obeying RollingUpdate strategy) and bring them back to the desired state of 2 replicas.

Final Thoughts

Up until this point, we have covered possible deployment approach for ProxySQL in Kubernetes. Running ProxySQL with the help of Kubernetes ConfigMap opens a new possibility of ProxySQL clustering, where it is somewhat different as compared to the native clustering support built-in inside ProxySQL.

In the upcoming blog post, we will explore ProxySQL Clustering using Kubernetes ConfigMap and how to do it the right way. Stay tuned!

SQL Firewalling Made Easy with ClusterControl & ProxySQL

$
0
0

Reading the title of this blog post may raise some questions. SQL firewall - what is that? What does it do? Why would I need something like that in the first place? Well, the ability to block certain queries could come in handy in certain situations. When using ProxySQL in front of your database servers, the proxy is able to inspect all SQL statements being sent. ProxySQL has a sophisticated rules engine, and can match queries that are to be allowed, blocked, re-written on the fly or routed to a specific database server. Let’s go through some examples.

You have a dedicated slave which is used by developers to test their queries against production data. You want to make sure the developers can only connect to that particular host and execute only SELECT queries.

Another case, let’s say that you encountered one too many accidents with people running schema changes and you would like to limit which users which can execute ALTER statement.

Finally, let’s think about a paranoid approach in which users are allowed to execute just a pre-defined whitelisted set of queries.

In our environment we have a replication setup with the master and two slaves.

In front of our databases, wee have three ProxySQL nodes with Keepalived managing Virtual IP. We also have ProxySQL cluster configured (as explained in this previous blog) so we don’t have to worry about making configuration or query rule changes three times on all three ProxySQL nodes. For the query rules, a simple read-write split is set up:

Let’s take a look at how ProxySQL, with its extensive query rules mechanism, can help us to achieve our goals in all those three cases.

Locking user access to a single hostgroup

A dedicated slave available to developers - this is not uncommon practice. As long as your developers can access production data (and if they are not allowed, e.g., due to compliance reasons, data masking as explained in our ProxySQL tutorial may help), this can help them to test and optimize queries on the real world data set. It may also help to verify data before executing some of the schema changes. For example, is my column really unique before adding a unique index?

With ProxySQL it is fairly easy to restrict access. For starters, let’s assume that the hostgroup 30 contains the slave we want developers to access.

We need an user which will be used by the developers to access that slave. If you have it already in ProxySQL, that’s fine. If not, you may either need to import it to ProxySQL (if it is created in MySQL but not in ProxySQL) or create it in both locations (if you’ll be creating a new user). Let’s go with the last option, creating a new user.

Let’s create a new user with limited privileges on both MySQL and ProxySQL. We will use it in query rules to identify traffic coming from the developers.

In this query rule we are going to redirect all of the queries which are executed by dev_test user to the hostgroup 30. We want this rule to be active and it should be the final one to parse, therefore we enabled ‘Apply’. We also configured RuleID to be smaller than the ID of the first existing rule as we want this query to be executed outside of the regular read/write split setup.

As you can see, we used an username but there are also other options.

If you can predict which development hosts will send the traffic to the database (for example, you can have developers use a specific proxy before they can reach the database), you can also use the “Client Address” option to match queries executed by that single host and redirect them to a correct hostgroup.

Disallowing user from executing certain queries

Now, let’s consider the case where we want to limit execution of some particular commands to a given user. This could be handy to ensure that the right people can run some of the performance impacting queries like schema changes. ALTER will be the query which we will use in this example. For starters, let’s add a new user which will be allowed to run schema changes. We will call it ‘admin_user’. Next, we need to create the required query rules.

We will create a query rule which uses ‘.*ALTER TABLE.*’ regular expression to match the queries. This query rule should be executed before other, read/write split rules. We assigned a rule ID of 20 to it. We define an error message that will be returned to the client in case this query rule will be triggered. Once done, we proceed to another query rule.

Here we use the same regular expression to catch the query but we don’t define any error text (which means that query will not return an error). We also define which user is allowed to execute it (admin_user in our case). We make sure this query is checked before the previous one, so we assigned a lower rule ID of 19 to it.

Once these two query rules are in place, we can test how they work. Let’s try to log in as an application user and run an ALTER TABLE query:

root@vagrant:~# mysql -P6033 -usbtest -ppass -h10.0.0.111
mysql: [Warning] Using a password on the command line interface can be insecure.
Welcome to the MySQL monitor.  Commands end with ; or \g.
Your MySQL connection id is 43160
Server version: 5.5.30 (ProxySQL)

Copyright (c) 2000, 2018, Oracle and/or its affiliates. All rights reserved.

Oracle is a registered trademark of Oracle Corporation and/or its
affiliates. Other names may be trademarks of their respective
owners.

Type 'help;' or '\h' for help. Type '\c' to clear the current input statement.

mysql> use sbtest;
Reading table information for completion of table and column names
You can turn off this feature to get a quicker startup with -A

Database changed
mysql> alter table sbtest1 add index (pad);
ERROR 1148 (42000): You are not allowed to execute ALTER
mysql> ^DBye

As expected, we couldn’t execute this query and we received an error message. Let’s now try to connect using our ‘admin_user’:

root@vagrant:~# mysql -P6033 -uadmin_user -ppass -h10.0.0.111
mysql: [Warning] Using a password on the command line interface can be insecure.
Welcome to the MySQL monitor.  Commands end with ; or \g.
Your MySQL connection id is 43180
Server version: 5.5.30 (ProxySQL)

Copyright (c) 2000, 2018, Oracle and/or its affiliates. All rights reserved.

Oracle is a registered trademark of Oracle Corporation and/or its
affiliates. Other names may be trademarks of their respective
owners.

Type 'help;' or '\h' for help. Type '\c' to clear the current input statement.

mysql> use sbtest;
Reading table information for completion of table and column names
You can turn off this feature to get a quicker startup with -A

Database changed
mysql> alter table sbtest1 add index (pad);
Query OK, 0 rows affected (0.99 sec)
Records: 0  Duplicates: 0  Warnings: 0

We managed to execute the ALTER as we logged in using ‘admin_user’. This is a very simple way of ensuring that only appointed people can run schema changes on your databases.

Creating a whitelist of allowed queries

Finally, let’s consider a tightly locked environment where only predefined queries can be executed. ProxySQL can be easily utilized to implement such setup.

First of all, we need to remove all existing query rules before we can implement what we need. Then, we need to create a catch-all query rule, which will block all the queries:

The rest we have to do is to create query rules for all of the queries which are allowed. You can do one rule per query. Or you can use regular expressions if, for example, SELECTs are always ok to run. The only thing you have to remember is that the rule ID has to be smaller than the rule ID of this catch-all rule, and ensure that the query will eventually hit the rule with ‘Apply’ enabled.

We hope that this blog post gave you some insight into how you can utilize ClusterControl and ProxySQL to improve security and ensure compliance of your databases.


New Webinar: How to Manage Replication Failover Processes for MySQL, MariaDB & PostgreSQL

$
0
0

If you’re looking at minimizing downtime and meet your SLAs through an automated or semi-automated approach, then this webinar is for you:

A detailed overview of what failover processes may look like in MySQL, MariaDB and PostgreSQL replication setups.

Failover is the process of moving to a healthy standby component, during a failure or maintenance event, in order to preserve uptime. The quicker it can be done, the faster you can be back online.

However, failover can be tricky for transactional database systems as we strive to preserve data integrity - especially in asynchronous or semi-synchronous topologies.

There are risks associated: from diverging datasets to loss of data. Failing over due to incorrect reasoning, e.g., failed heartbeats in the case of network partitioning, can also cause significant harm.

In this webinar we’ll cover the dangers related to the failover process, and discuss the tradeoffs between failover speed and data integrity. We’ll find out about how to shield applications from database failures with the help of proxies.

And we will finally have a look at how ClusterControl manages the failover process, and how it can be configured for both assisted and automated failover.

Date, Time & Registration

Europe/MEA/APAC

Tuesday, December 11th at 09:00 GMT / 10:00 CET (Germany, France, Sweden)

Register Now

North America/LatAm

Tuesday, December 11th at 09:00 PT (US) / 12:00 ET (US)

Register Now

Agenda

  • An introduction to failover - what, when, how
    • in MySQL / MariaDB
    • in PostgreSQL
  • To automate or not to automate
  • Understanding the failover process
  • Orchestrating failover across the whole HA stack
  • Difficult problems
    • Network partitioning
    • Missed heartbeats
    • Split brain
  • From assisted to fully automated failover with ClusterControl
    • Demo

Speaker

Krzysztof Książek, Senior Support Engineer at Severalnines, is a MySQL DBA with experience managing complex database environments for companies like Zendesk, Chegg, Pinterest and Flipboard.

How to Encrypt Your MySQL & MariaDB Backups

$
0
0

We usually take care of things we value, whether it is an expensive smartphone or the company’s servers. Data is one of the most important assets of the organisation, and although we do not see it, it has to be carefully protected. We implement data at rest encryption to encrypt database files or whole volumes which contain our data. We implement data in transit encryption using SSL to make sure no one can sniff and collect data sent across networks. Backups are no different. No matter if this is a full backup or incremental, it will store at least a part of your data. As such, backups have to be encrypted too. In this blog post, we will look into some options you may have when it comes to encrypting backups. First though, let’s look at how you can encrypt your backups and what could be use cases for those methods.

How to encrypt your backup?

Encrypt local file

First of all, you can easily encrypt existing files. Let’s imagine that you have a backup process storing all your backups on a backup server. At some point you decided it’s the high time to implement offsite backup storage for disaster recovery. You can use S3 or similar infrastructure from other cloud providers for that. Of course, you don’t want to upload unencrypted backups anywhere outside of your trusted network, therefore it is critical that you implement backup encryption one way or the other. A very simple method, not requiring any changes in your existing backup scripts would be to create a script which will take a backup file, encrypt it and upload it to S3. One of the methods you can use to encrypt the data is to use openssl:

openssl enc -aes-256-cbc -salt -in backup_file.tar.gz -out backup_file.tar.gz.enc -k yoursecretpassword

This will create a new, encrypted file, ‘backup_file.tar.gz.enc’ in the current directory. You can always decrypt it later by running:

openssl aes-256-cbc -d -in backup_file.tar.gz.enc -out backup_file.tar.gz -k yoursecretpassword

This method is very simple, but it has some drawbacks. The biggest one is the disk space requirements. When encrypting like we described above, you have to keep both unencrypted and encrypted file and in the result you require a disk space twice the size of the backup file. Of course, depending on your requirements, this might be something you want - keeping non-encrypted files locally will improve recovery speed - after all decrypting the data will also take some time.

Encrypt backup on the fly

To avoid the need of storing both encrypted and unencrypted data, you may want to implement the encryption at the earlier stage of the backup process. We can do that through pipes. Pipes are, in short, a way of sending the data from one command to another. This makes it possible to create a chain of commands that processes data. You can generate the data, then compress it and encrypt. An example of such chain might be:

mysqldump --all-databases --single-transaction --triggers --routines | gzip | openssl  enc -aes-256-cbc -k mypass > backup.xb.enc

You can also use this method with xtrabackup or mariabackup. In fact, this is the example from MariaDB documentation:

mariabackup --user=root --backup --stream=xbstream  | openssl  enc -aes-256-cbc -k mypass > backup.xb.enc

If you want, you can even try to upload data as the part of the process:

mysqldump --all-databases --single-transaction --triggers --routines | gzip | openssl  enc -aes-256-cbc -k mysecretpassword | tee -a mysqldump.gz.enc | nc 10.0.0.102 9991

As a result, you will see a local file ‘mysqldump.gz.enc’ and copy of the data will be piped to a program which will do something about it. We used ‘nc’, which streamed data to another host on which following was executed:

nc -l 9991 > backup.gz.enc

In this example we used mysqldump and nc but you can use xtrabackup or mariabackup and some tool which will upload the stream to Amazon S3, Google Cloud Storage or some other cloud provider. Any program or script which accepts data on stdin can be used instead of ‘nc’.

Use embedded encryption

In some of the cases, a backup tool has embedded support for encryption. An example here is xtrabackup, which can internally encrypt the file. Unfortunately, mariabackup, even though it is a fork of xtrabackup, does not support this feature.

Before we can use it, we have to create a key which will be used to encrypt the data. It can be done by running the following command:

root@vagrant:~# openssl rand -base64 24
HnliYiaRo7NUvc1dbtBMvt4rt1Fhunjb

Xtrabackup can accept the key in plain text format (using --encrypt-key option) or it can read it from file (using --encrypt-key-file option). The latter is safer as passing passwords and keys as plain text to commands result in storing them in the bash history. You can also see it clearly on the list of running processes, which is quite bad:

root      1130  0.0  0.6  65508  4988 ?        Ss   00:46   0:00 /usr/sbin/sshd -D
root     13826  0.0  0.8  93100  6648 ?        Ss   01:26   0:00  \_ sshd: root@notty
root     25363  0.0  0.8  92796  6700 ?        Ss   08:54   0:00  \_ sshd: vagrant [priv]
vagrant  25393  0.0  0.6  93072  4936 ?        S    08:54   0:01  |   \_ sshd: vagrant@pts/1
vagrant  25394  0.0  0.4  21196  3488 pts/1    Ss   08:54   0:00  |       \_ -bash
root     25402  0.0  0.4  52700  3568 pts/1    S    08:54   0:00  |           \_ sudo su -
root     25403  0.0  0.4  52284  3264 pts/1    S    08:54   0:00  |               \_ su -
root     25404  0.0  0.4  21196  3536 pts/1    S    08:54   0:00  |                   \_ -su
root     26686  6.0  4.0 570008 30980 pts/1    Sl+  09:48   0:00  |                       \_ innobackupex --encrypt=AES256 --encrypt-key=TzIZ7g+WzLt0PXWf8WDPf/sjIt7UzCKw /backup/

Ideally, you will use the key stored in a file but then there’s a small gotcha you have to be aware of.

root@vagrant:~# openssl rand -base64 24 > encrypt.key
root@vagrant:~# innobackupex --encrypt=AES256 --encrypt-key-file=/root/encrypt.key /backup/
.
.
.
xtrabackup: using O_DIRECT
InnoDB: Number of pools: 1
encryption: unable to set libgcrypt cipher key - User defined source 1 : Invalid key length
encrypt: failed to create worker threads.
Error: failed to initialize datasink.

You may wonder what the problem is. It’ll become clear when we will open encrypt.key file in a hexadecimal editor like hexedit:

00000000   6D 6B 2B 4B  66 69 55 4E  5A 49 48 77  39 42 36 72  68 70 39 79  6A 56 44 72  47 61 79 45  6F 75 6D 70  0A                                     mk+KfiUNZIHw9B6rhp9yjVDrGayEoump.

You can now notice the last character encoded using ‘0A’. This is basically the line feed character, but it is taken under consideration while evaluating the encryption key. Once we remove it, we can finally run the backup.

root@vagrant:~# innobackupex --encrypt=AES256 --encrypt-key-file=/root/encrypt.key /backup/
xtrabackup: recognized server arguments: --datadir=/var/lib/mysql --innodb_buffer_pool_size=185M --innodb_flush_log_at_trx_commit=2 --innodb_file_per_table=1 --innodb_data_file_path=ibdata1:100M:autoextend --innodb_read_io_threads=4 --innodb_write_io_threads=4 --innodb_doublewrite=1 --innodb_log_file_size=64M --innodb_log_buffer_size=16M --innodb_log_files_in_group=2 --innodb_flush_method=O_DIRECT --server-id=1
xtrabackup: recognized client arguments: --datadir=/var/lib/mysql --innodb_buffer_pool_size=185M --innodb_flush_log_at_trx_commit=2 --innodb_file_per_table=1 --innodb_data_file_path=ibdata1:100M:autoextend --innodb_read_io_threads=4 --innodb_write_io_threads=4 --innodb_doublewrite=1 --innodb_log_file_size=64M --innodb_log_buffer_size=16M --innodb_log_files_in_group=2 --innodb_flush_method=O_DIRECT --server-id=1 --databases-exclude=lost+found --ssl-mode=DISABLED
encryption: using gcrypt 1.6.5
181116 10:11:25 innobackupex: Starting the backup operation

IMPORTANT: Please check that the backup run completes successfully.
           At the end of a successful backup run innobackupex
           prints "completed OK!".

181116 10:11:25  version_check Connecting to MySQL server with DSN 'dbi:mysql:;mysql_read_default_group=xtrabackup;mysql_socket=/var/lib/mysql/mysql.sock' as 'backupuser'  (using password: YES).
181116 10:11:25  version_check Connected to MySQL server
181116 10:11:25  version_check Executing a version check against the server...
181116 10:11:25  version_check Done.
181116 10:11:25 Connecting to MySQL server host: localhost, user: backupuser, password: set, port: not set, socket: /var/lib/mysql/mysql.sock
Using server version 5.7.23-23-57
innobackupex version 2.4.12 based on MySQL server 5.7.19 Linux (x86_64) (revision id: 170eb8c)
xtrabackup: uses posix_fadvise().
xtrabackup: cd to /var/lib/mysql
xtrabackup: open files limit requested 0, set to 1024
xtrabackup: using the following InnoDB configuration:
xtrabackup:   innodb_data_home_dir = .
xtrabackup:   innodb_data_file_path = ibdata1:100M:autoextend
xtrabackup:   innodb_log_group_home_dir = ./
xtrabackup:   innodb_log_files_in_group = 2
xtrabackup:   innodb_log_file_size = 67108864
xtrabackup: using O_DIRECT
InnoDB: Number of pools: 1
181116 10:11:25 >> log scanned up to (2597648)
xtrabackup: Generating a list of tablespaces
InnoDB: Allocated tablespace ID 19 for mysql/server_cost, old maximum was 0
181116 10:11:25 [01] Encrypting ./ibdata1 to /backup/2018-11-16_10-11-25/ibdata1.xbcrypt
181116 10:11:26 >> log scanned up to (2597648)
181116 10:11:27 >> log scanned up to (2597648)
181116 10:11:28 [01]        ...done
181116 10:11:28 [01] Encrypting ./mysql/server_cost.ibd to /backup/2018-11-16_10-11-25/mysql/server_cost.ibd.xbcrypt
181116 10:11:28 [01]        ...done
181116 10:11:28 [01] Encrypting ./mysql/help_category.ibd to /backup/2018-11-16_10-11-25/mysql/help_category.ibd.xbcrypt
181116 10:11:28 [01]        ...done
181116 10:11:28 [01] Encrypting ./mysql/slave_master_info.ibd to /backup/2018-11-16_10-11-25/mysql/slave_master_info.ibd.xbcrypt
181116 10:11:28 [01]        ...done

As a result we will end up with a backup directory full of encrypted files:

root@vagrant:~# ls -alh /backup/2018-11-16_10-11-25/
total 101M
drwxr-x---  5 root root 4.0K Nov 16 10:11 .
drwxr-xr-x 16 root root 4.0K Nov 16 10:11 ..
-rw-r-----  1 root root  580 Nov 16 10:11 backup-my.cnf.xbcrypt
-rw-r-----  1 root root  515 Nov 16 10:11 ib_buffer_pool.xbcrypt
-rw-r-----  1 root root 101M Nov 16 10:11 ibdata1.xbcrypt
drwxr-x---  2 root root 4.0K Nov 16 10:11 mysql
drwxr-x---  2 root root  12K Nov 16 10:11 performance_schema
drwxr-x---  2 root root  12K Nov 16 10:11 sys
-rw-r-----  1 root root  113 Nov 16 10:11 xtrabackup_checkpoints
-rw-r-----  1 root root  525 Nov 16 10:11 xtrabackup_info.xbcrypt
-rw-r-----  1 root root 2.7K Nov 16 10:11 xtrabackup_logfile.xbcrypt

Xtrabackup has some other variables which can be used to tune encryption performance:

  • --encrypt-threads allows for parallelization of the encryption process
  • --encrypt-chunk-size defines a working buffer for encryption process.

Should you need to decrypt the files, you can use innobackupex with --decrypt option for that:

root@vagrant:~# innobackupex --decrypt=AES256 --encrypt-key-file=/root/encrypt.key /backup/2018-11-16_10-11-25/

As xtrabackup does not clean encrypted files, you may want to remove them using following one-liner:

for i in `find /backup/2018-11-16_10-11-25/ -iname "*\.xbcrypt"`; do rm $i ; done

Backup encryption in ClusterControl

With ClusterControl encrypted backups are just one click away. All backup methods (mysqldump, xtrabackup or mariabackup) support encryption. You can both create a backup ad hoc or you can prepare a schedule for your backups.

In our example we picked a full xtrabackup, we will store it on the controller instance.
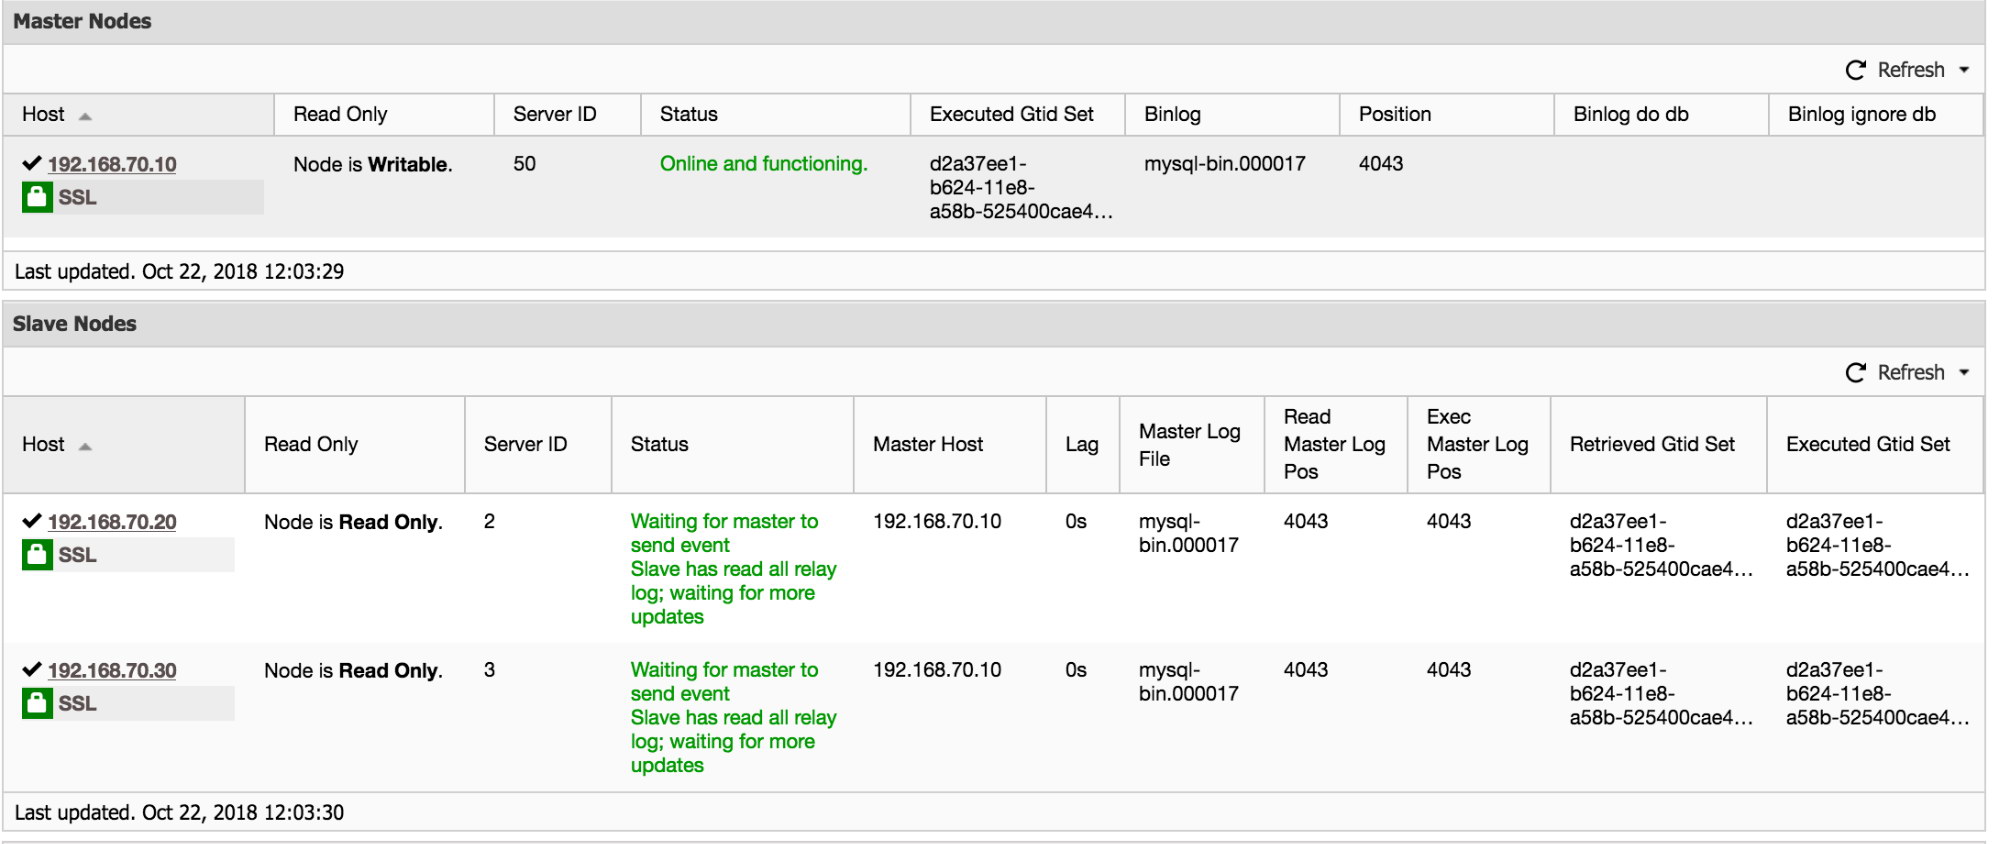
On the next page we enabled the encryption. As stated, ClusterControl will automatically create an encryption key for us. This is it, when you click at the “Create Backup” button a process will be started.

New backup is visible on the backup list. It is marked as encrypted (the lock icon).

We hope that this blog post gives you some insights into how to make sure your backups are properly encrypted.

Database Backups - Comparing MariaDB Mariabackup and Percona Xtrabackup

$
0
0

Your database server stores some of your enterprise’s most valuable information. Guaranteeing reliable database backups to prevent data loss in the event of an accident or hardware failure is a critical checkbox.

Whether it is a 24x7 highly loaded server or a low-transaction-volume environment, you will be in the need of making backups a seamless procedure without disrupting the performance of the server in a production environment.

In this blog, we are going to review two of the most used tools to accomplish this task, namely Percona XtraBackup and Mariabackup. We will review the similarities and differences between the two of them, and also how to use them.

What is Percona XtraBackup?

Percona XtraBackup is an open source tool for performing backups of MariaDB, MySQL and Percona Server databases. It performs online non-blocking (for the supported engines*), tightly compressed and secure full backups on transactional systems so that applications remain fully available for the duration of the backup window.

By using this tool you can:

  • Create hot InnoDB backups, that complete quickly and reliably, without pausing your database or adding load to the server
  • Make incremental backups
  • Move tables between MySQL servers on-line
  • Create new MySQL replication slaves easily
  • Stream compressed MySQL backups to another server
  • Save on disk space and network bandwidth

What is Mariabackup?

Mariabackup is an open source tool provided by MariaDB for performing physical online backups. It is a fork of Percona XtraBackup designed to work with encrypted and compressed tables, and is the recommended backup method for MariaDB databases.

MariaDB Server 10.1 introduced MariaDB Compression and Data-at-Rest Encryption, but the existing backup solutions did not support full backup capability for these features. So MariaDB decided to extend XtraBackup (version 2.3.8) and named this solution Mariabackup.

Differences Between Percona XtraBackup and Mariabackup

As we noted earlier, Mariabackup is the recommended backup tool for MariaDB, and the main difference from XtraBackup is that it works with encrypted and compressed tables.

Anyway, if for any particular reason you want to use XtraBackup for your MariaDB database, there are some points to take into account depending on the MariaDB server version you have:

  • MariaDB 10.1: With uncompressed and unencrypted MariaDB data, you can use XtraBackup. If encryption or compression is used, or when innodb_page_size is set to some value other than 16K it will not work.
  • MariaDB 10.2: You might also want to try to use XtraBackup, but be aware that problems are likely due to the MySQL 5.7 undo log format incompatibility bug that was fixed in MariaDB 10.2.2. Due to this bug, backups prepared with XtraBackup may fail to recover some transactions. Only if you run the server with the setting innodb_undo_logs=1 this would not be a problem.
  • MariaDB 10.3 and later: This case is more simple. XtraBackup is not compatible.
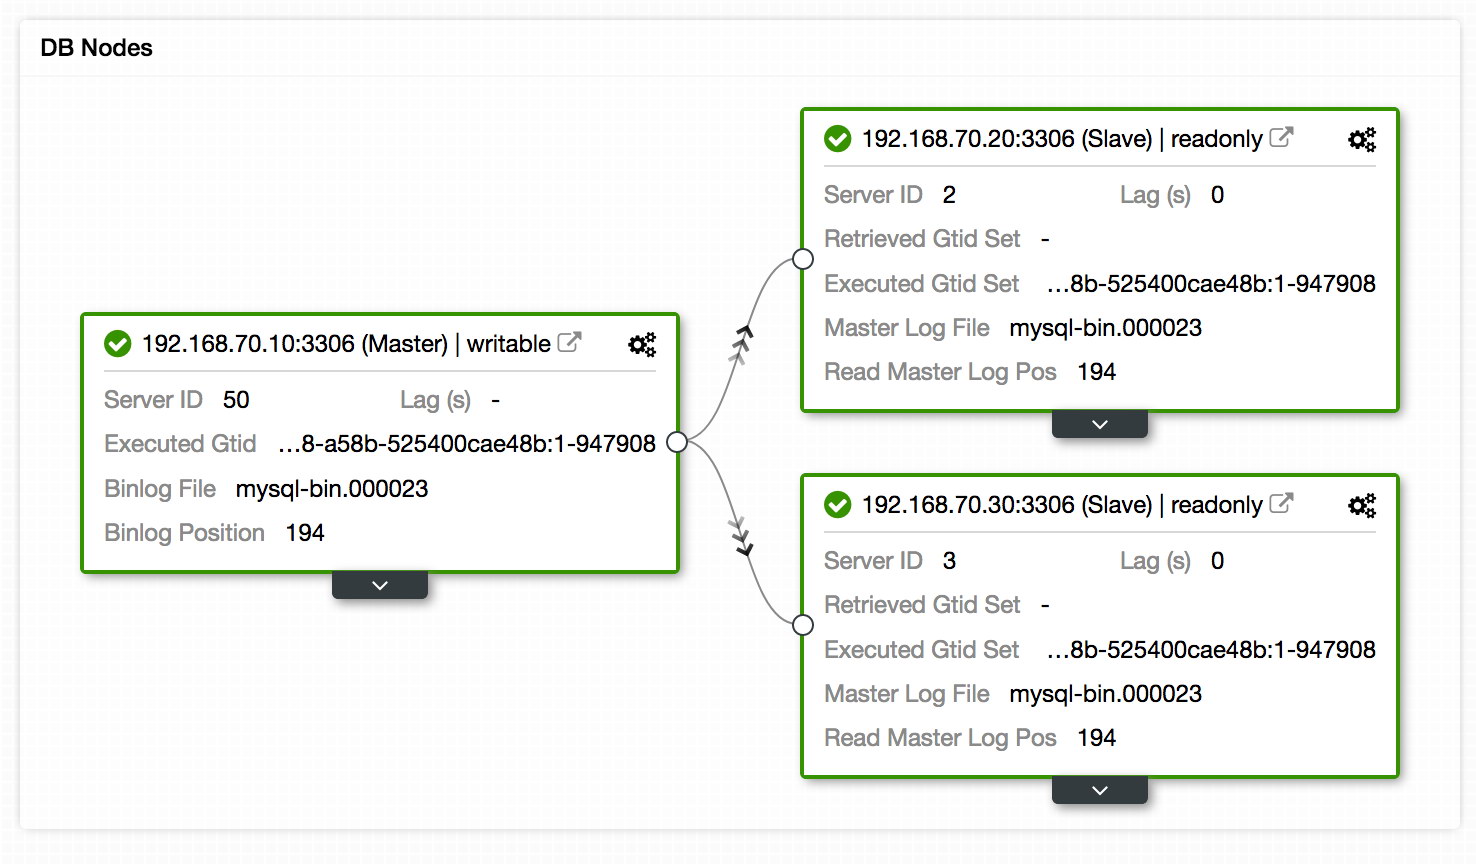
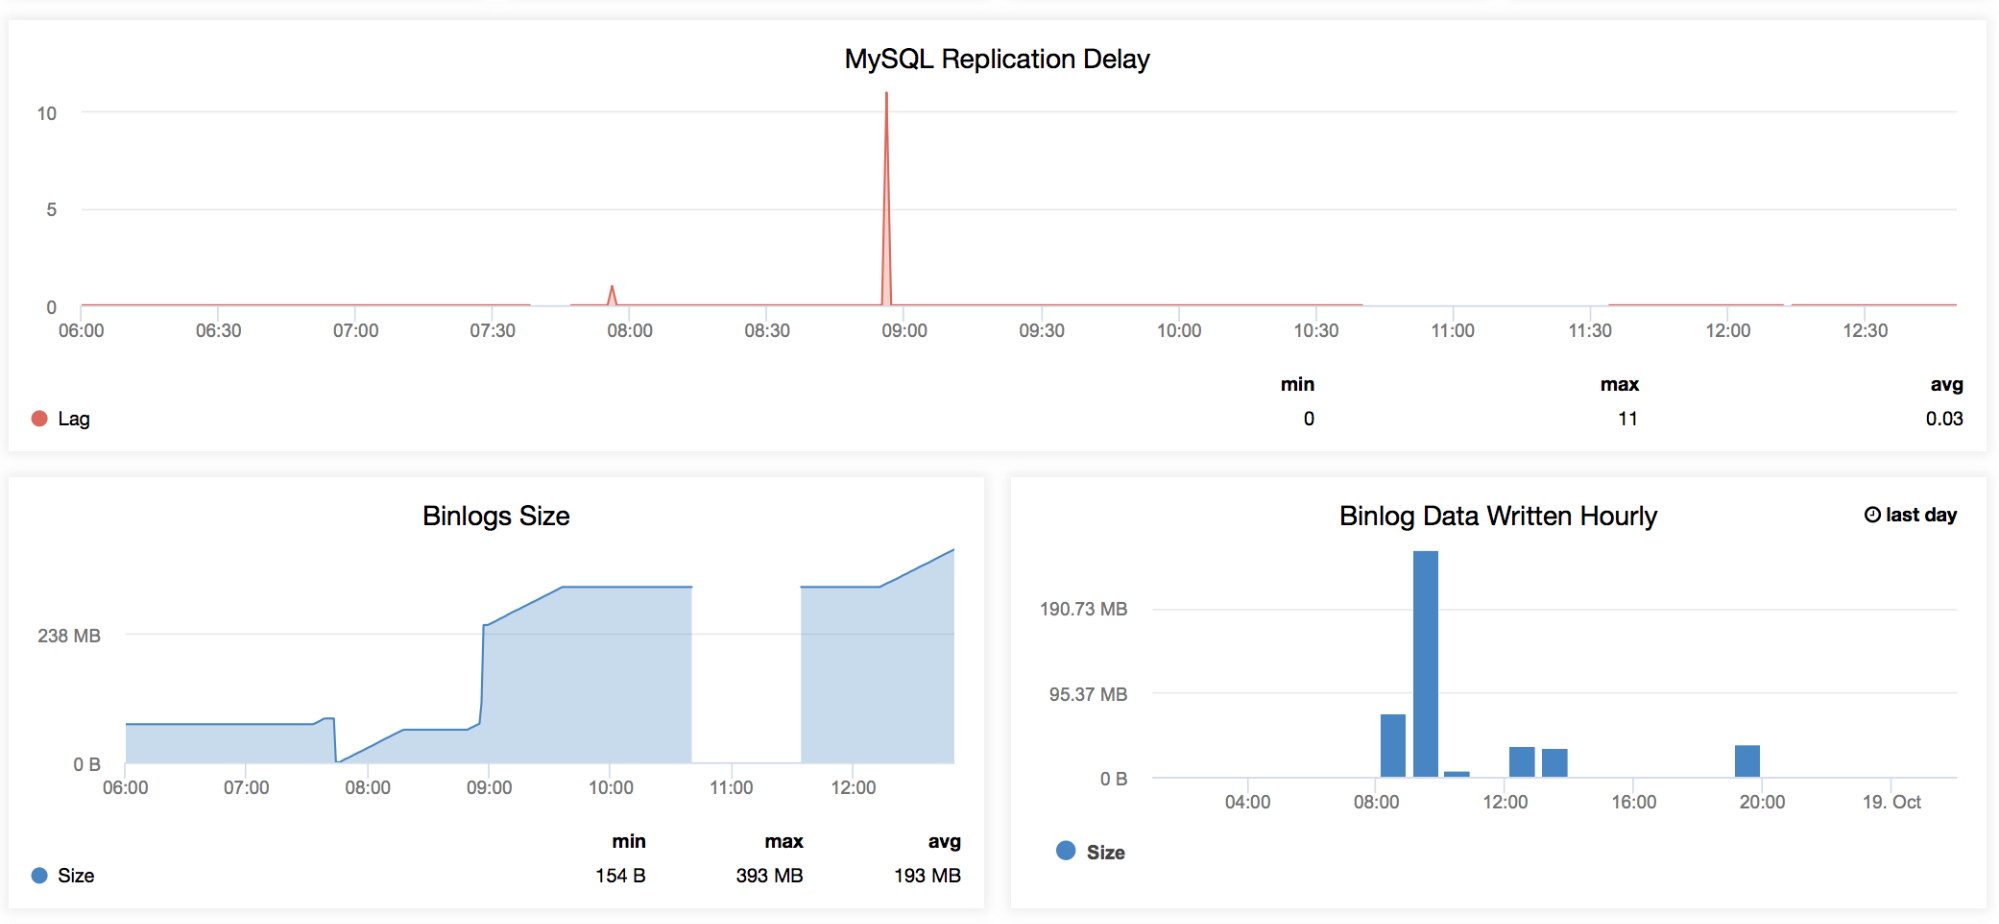
Also, there are some limitations to take into account when using Mariabackup:

  • MyRocks: Starting with MariaDB 10.2.16 and MariaDB 10.3.8, Mariabackup will backup MyRocks Storage Engine data. Partial backup of MyRocks data is currently not supported. Incremental backup will store a full copy of MyRocks data.
  • Export file functionality: Before MariaDB 10.2.9, Mariabackup did not support the --export functionality (it creates an export file to export data from the database). You can workaround this limitation by preparing the backup as usual (without the --export flag), then start the server and execute FLUSH TABLES FOR EXPORT.
  • Log files: Mariabackup versions until 10.2.8 do not create empty log files and relies on the --copy-back action executed by user (which deletes old innodb log files, if any). If the user doesn't use --copy-back or makes sure that the data directory is empty before restoring, the backups created with these versions may well become inconsistent/corrupted (because of the presence of leftover InnoDB logs).
  • Gcrypt: Backup tool based encryption (gcrypt) is not supported on Mariabackup.
  • Innobackupex option: No symlink to innobackupex (use the --innobackupex parameter instead). The innobackupex tool patches and provides additional features over the innobackup tool for backing up InnoDB and MyISAM tables.
  • Compact option: --compact option is not supported.
  • Rebuild indexes option: --rebuild_indexes option is not supported.
  • Tar for backup files: Support for --stream=tar was removed in Mariabackup 10.1.24 (The --streams options streams backup files to stdout).

At last but not least, Mariabackup can be installed on Windows.

Backup Process
Backup Process
Restore Process
Restore Process

How to - Percona XtraBackup and Mariabackup

Let's see how we can install and use it.

Installation

You have different methods to install both XtraBackup and Mariabackup. Let's try the installation from repositories.

XtraBackup Installation

On Debian/Ubuntu
$ wget https://repo.percona.com/apt/percona-release_0.1-6.$(lsb_release -sc)_all.deb
$ sudo dpkg -i percona-release_0.1-6.$(lsb_release -sc)_all.deb
$ sudo apt-get update
$ sudo apt-get install percona-xtrabackup-24
On RedHat/CentOS
$ sudo yum install http://www.percona.com/downloads/percona-release/redhat/0.1-6/percona-release-0.1-6.noarch.rpm
$ sudo yum install percona-xtrabackup-24

Mariabackup Installation

On Debian / Ubuntu

Mariabackup is part of MariaDB Server starting with MariaDB 10.1.23.

$ sudo apt-get install software-properties-common
$ sudo apt-key adv --recv-keys --keyserver hkp://keyserver.ubuntu.com:80 0xF1656F24C74CD1D8
$ sudo add-apt-repository 'deb [arch=amd64,arm64,ppc64el] http://nyc2.mirrors.digitalocean.com/mariadb/repo/10.1/ubuntu bionic main'
$ sudo apt-get update
$ sudo apt-get install mariadb-server-10.1
On CentOS / RedHat
$ sudo vi /etc/yum.repos.d/MariaDB.repo
[mariadb]
name=MariaDB
baseurl=http://yum.mariadb.org/10.1/centos7-amd64
gpgkey=https://yum.mariadb.org/RPM-GPG-KEY-MariaDB
gpgcheck=1
$ sudo yum install MariaDB-backup

Configuration

Both Xtrabackup and Mariabackup read the [mysqld] and [xtrabackup] sections of any MySQL configuration file, in that order. In this way, it can read MySQL parameters, such as datadir or InnoDB parameters.

We can modify the parameters included in the [mysqld] section by modifying their value in [xtrabackup], as we mentioned before, they are read in order, so the last thing we have in [xtrabackup] will have priority.

[mysqld]
datadir=/data/datadir
[xtrabackup]
target_dir=/backups/

The user with the minimum privileges required to full backups would be RELOAD, LOCK TABLES, PROCESS and REPLICATION CLIENT:

mysql> CREATE USER 'backupuser'@'localhost' IDENTIFIED BY 'Password';
mysql> GRANT RELOAD, LOCK TABLES, PROCESS, REPLICATION CLIENT ON *.* TO 'backupuser'@'localhost';

And then, you can add this user in the MySQL configuration files:

[xtrabackup]
user=backupuser
password=Password

Also, you can use Xtrabackup or Mariabackup to perform the State Snapshot Transfers when you are using a Percona XtraDB Cluster or MariaDB Galera Cluster. You must set the wsrep_sst_method and the wsrep_sst_auth variables in the configuration files:

[mysqld]
wsrep_sst_method=xtrabackup-v2
wsrep_sst_auth=backupuser:Password

Or

[mysqld]
wsrep_sst_method=mariabackup
wsrep_sst_auth=backupuser:Password

Usage

Since Mariabackup is based on XtraBackup, it can be used similarly.

Now let's see an example using both methods to create, prepare and restore a full backup.

Creating a backup

To create a new backup with XtraBackup or Mariabackup, you need to add the --backup and --target-dir options to the command line:

$ xtrabackup --backup --target-dir=/backups/

Or

$ mariabackup --backup --target-dir=/backups/

The target dir, where the backup will be stored, can be specified in the MySQL configuration files. The backup process will not overwrite existing files. If the file exists the backup will fail.

Transaction log of lsn (9755450) to (9755467) was copied.
181122 23:02:44 completed OK!

If everything went fine, the last line that you see should be "completed OK!". You can cancel the backup at any time, as it doesn't modify the database's content.

[root@MySQL1 ~]# ls -l /backups/
total 102448
-rw-r----- 1 root root       488 Nov 22 23:02 backup-my.cnf
-rw-r----- 1 root root       482 Nov 22 23:02 ib_buffer_pool
-rw-r----- 1 root root 104857600 Nov 22 23:02 ibdata1
drwxr-x--- 2 root root      4096 Nov 22 23:02 mysql
drwxr-x--- 2 root root      4096 Nov 22 23:02 performance_schema
drwxr-x--- 2 root root      4096 Nov 22 23:02 sakila
drwxr-x--- 2 root root     12288 Nov 22 23:02 sys
-rw-r----- 1 root root        64 Nov 22 23:02 xtrabackup_binlog_info
-rw-r----- 1 root root       113 Nov 22 23:02 xtrabackup_checkpoints
-rw-r----- 1 root root       533 Nov 22 23:02 xtrabackup_info
-rw-r----- 1 root root      2560 Nov 22 23:02 xtrabackup_logfile

This should be the content of your backup. It could change depending on your databases.

Preparing a backup

When you have your backup created with XtraBackup or Mariabackup, you need to prepare it to be restored. Data files aren't consistent until they’ve been prepared, because they were copied at different times during the duration of the backup. If you try to restore it and start your database, it will detect corruption and crash itself to prevent you from running on inconsistent data.

To prepare the backup, you need to run the command xtrabackup or mariabackup with --prepare option and specify the target dir where is stored the backup.

$ xtrabackup --prepare --target-dir=/backups/

Or

$ mariabackup --prepare --target-dir=/backups/
InnoDB: Shutdown completed; log sequence number 9757224
181122 23:05:29 completed OK!

The last line that you see should be "Shutdown completed; log sequence number xxxxxxx" and "completed OK!" if everything went fine. It's not recommended to cancel the prepare process because it may cause data file corruption and the backup will become unusable.

If you want to use this backup with an incremental backup later, you should use the --apply-log-only option when preparing it, or you will not be able to do it.

Restoring a Backup

After preparing the backup, you can use the restore option with the parameters --copy-back or --move-back, to copy or move the backup to the datadir. If you don't have enough disk space, you probably should use the move option. Also, we need to specify the target dir where the backup is stored. Keep in mind that the datadir must be empty and the database service should be down before restoring the backup.

$ xtrabackup --copy-back --target-dir=/backups/

Or

$ mariabackup --copy-back --target-dir=/backups/

It will first copy/move the MyISAM tables and indexes, InnoDB tables and indexes next and the log files at last. It will preserve file’s attributes when copying them, you may have to change the files’ ownership to mysql before starting the database server, as they will be owned by the user who created the backup.

$ sudo chown -R mysql:mysql /var/lib/mysql

There are several parameters to use with Xtrabackup and Mariabackup. You can check these parameters here for XtraBackup, and here for Mariabackup.

ClusterControl
Single Console for Your Entire Database Infrastructure
Find out what else is new in ClusterControl

Managing Your Backups on ClusterControl

As we saw above, running a backup is not rocket science. It can also be scheduled with cron (but beware of silent failures!). However, a script to regularly create backups is not a backup management solution. You need a way to report on your backups, and alert on failures. Now, configuring backups in your environment and seeing the backups work without error does not mean everything is good. You might have heard about Schrödinger’s backup, which states that the condition of any backup is unknown until a restore is attempted. Because the worse thing that can happen is a disaster and you realize the backups are wrong for some reason. You try to restore the files that were backed up, and it does not restore what you think you backed up, or it does not restore at all! Then there are things like moving backup files offsite, e.g. to external cloud storage, for disaster recovery. Encryption and handling of keys are important for security. Retention of local as well as external/archived backups also need to be managed.

Let's see how ClusterControl can help.

If you want to use the ClusterControl Backup feature, go to ClusterControl -> Select Cluster -> Backup, and there you can see your current backups, create or schedule a new one.

ClusterControl Backup Section

Using the create or schedule option, we can choose both, XtraBackup or Mariabackup method. In the same section, we can choose the server from which to take the backup, enable partial backup, choose where you want to store the backup and if you want to upload the backup to the cloud (AWS, Azure or Google Cloud).

ClusterControl Create Backup 1

Then, we can select backup parameters like compression, encryption and retention.

ClusterControl Create Backup 2

And these should be the commands that ClusterControl will run for you:

[16:37:58]: 192.168.100.120: Launching ( LC_ALL=C /usr/bin/innobackupex --defaults-file=/etc/my.cnf --galera-info --parallel 1 --stream=xbstream --no-timestamp . | gzip -6 - > /root/backups/BACKUP-13/backup-full-2018-11-14_193757.xbstream.gz ) 2>&1.

Or

[16:29:57]: 192.168.100.131: Launching ( LC_ALL=C /usr/bin/mariabackup --defaults-file=/etc/my.cnf --backup --galera-info --parallel 1 --stream=xbstream --no-timestamp | gzip -6 - > /root/backups/BACKUP-11/backup-full-2018-11-14_192957.xbstream.gz ) 2>&1.

This command could be different depending on which parameters you chose.

As we could see, ClusterControl is a good friend if we want to use XtraBackup or Mariabackup. We can run complex backup commands in an easy way, by selecting the options from the ClusterControl UI.
ClusterControl support both full or incremental backup, so we can configure all our backup strategy from a friendly UI.

Conclusion

When backing up a MariaDB server, it is recommended to use the Mariabackup tool. However, if for some reason you prefer to use XtraBackup, you still can. But you need to keep in mind the restrictions that apply, as we have noted in this blog. And finally, we discussed how a script to backup a database is not the same thing as a backup management solution, and had a quick look at ClusterControl.

Let us know if we missed any differences between the XtraBackup and MariaBackup.


*The non-blocking backups are supported for InnoDB, XtraDB, and HailDB storage engines. The following storage engines can be backed up by briefly pausing writes at the end of the backup: MyISAM, Merge, and Archive, including partitioned tables, triggers, and database options.

Cloud Backup Options for MySQL & MariaDB Databases

$
0
0

The principal objective of backing up your data is, of course, the ability to roll back and access your archives in case of hardware failure. To do business today, you need the certainty of knowing that in the case of disaster, your data will be protected and accessible. You would need to store your backups offsite, in case your datacenter goes down in flames.

Data protection remains a challenge for small and medium-sized businesses. Small-to-medium sized businesses prefer to archive their company’s data using direct-attached storage, with the majority of firms having plans to do offsite backup copies. Local storage approach can lead to one of the most severe dilemmas the modern company can face - loss of data in case of disaster.

Many factors come into deliberation when judging on whether to allow a business critical database to be transferred offsite, and when choosing a suitable vendor to do so. Traditional methods like writing to tape and shipping to a remote location can be a complicated process that requires special hardware, adequately trained staff and procedures to ensure that backups are regularly produced, protected and that the information contained in them is verified for integrity. Small businesses usually have small IT budgets. Often they can not afford to have a secondary datacenter, even if they have a dedicated data center. But nevertheless, it is still important to keep a copy of your backup files offsite. Disasters like hurricane, flood, fire or theft can destroy your servers and storage. Keeping backed up data in the separate data center ensures data is safe, no matter what is going on in your primary datacenter. Cloud storage is a great way of addressing this problem.
With the cloud backup approach, there are a number of factors to consider. Some of the questions you have are:

  • Is backed-up data secured at rest in the external data center?
  • Is transfer to or from the external data center through the public internet network safe?
  • Is there an effect on RTO (Recovery Time Objective)?
  • Is the backup and recovery process easy enough for our IT staff?
  • Are there any changes required to existing processes?
  • Are the 3rd party backup tools needed?
  • What are the additional costs in terms of required software or data transfer?
  • What are the storage costs?

Backup features when doing a backup to the cloud

If your MySQL server or backup destination is located in an exposed infrastructure like a public cloud, hosting provider or connected through an untrusted WAN network, you need to think about additional actions in your backup policy. There are few different ways to perform database backups for MySQL, and depending on the type of backup, recovery time, size, and infrastructure options will vary. Since many of the cloud storage solutions are simply storage with different API front ends, any backup solution can be performed with a bit of scripting. So what are the options we have to make process smooth and secure?

Encryption

It is always a good idea to enforce encryption to enhance the security of backup data. A simple use case to implement encryption is where you want to push the backup to an offsite backup storage located in the public cloud.

When creating an encrypted backup, one thing to have in mind is that it usually takes more time to recover. The backup has to be decrypted before any recovery activities. With a big dataset, this could introduce some delays to the RTO.

On the other hand, if you are using private key for encryption, make sure to store the key in a safe place. If the private key is missing, the backup will be useless and unrecoverable. If the key is stolen, all created backups that use the same key would be compromised as they are no longer secured. You can use the popular GnuPG or OpenSSL to generate the private or public keys.
To perform mysqldump encryption using GnuPG, generate a private key and follow the wizard accordingly:

$ gpg --gen-key

Create a plain mysqldump backup as usual:

$ mysqldump --routines --events --triggers --single-transaction db1 | gzip > db1.tar.gz

Encrypt the dump file and remove the older plain backup:

$ gpg --encrypt -r ‘admin@email.com’ db1.tar.gz
$ rm -f db1.tar.gz

GnuPG will automatically append .gpg extension on the encrypted file. To decrypt,
simply run the gpg command with --decrypt flag:

$ gpg --output db1.tar.gz --decrypt db1.tar.gz.gpg

To create an encrypted mysqldump using OpenSSL, one has to generate a private key and a public key:
OpenSSL req -x509 -nodes -newkey rsa:2048 -keyout dump.priv.pem -out dump.pub.pem

This private key (dump.priv.pem) must be kept in a safe place for future decryption. For mysqldump, an encrypted backup can be created by piping the content to openssl, for example

mysqldump --routines --events --triggers --single-transaction database | openssl smime -encrypt -binary -text -aes256
-out database.sql.enc -outform DER dump.pub.pem

To decrypt, simply use the private key (dump.priv.pem) alongside the -decrypt flag:
openssl smime -decrypt -in database.sql.enc -binary -inform

DEM -inkey dump.priv.pem -out database.sql

Percona XtraBackup can be used to encrypt or decrypt local or streaming backups with xbstream option to add another layer of protection to the backups. Encryption is done with the libgcrypt library. Both --encrypt-key option and --encryptkey-file option can be used to specify the encryption key. Encryption keys can be generated with commands like

$ openssl rand -base64 24
$ bWuYY6FxIPp3Vg5EDWAxoXlmEFqxUqz1

This value then can be used as the encryption key. Example of the innobackupex command using the --encrypt-key:

$ innobackupex --encrypt=AES256 --encrypt-key=”bWuYY6FxIPp3Vg5EDWAxoXlmEFqxUqz1” /storage/backups/encrypted

The output of the above OpenSSL command can also be redirected to a file and can be treated as a key file:

openssl rand -base64 24 > /etc/keys/pxb.key

Use it with the --encrypt-key-file option instead:

innobackupex --encrypt=AES256 --encrypt-key-file=/etc/keys/pxb.key /storage/backups/encrypted

To decrypt, simply use the --decrypt option with appropriate --encrypt-key or --encrypt-key-file:

$ innobackupex --decrypt=AES256 --encrypt-key=”bWuYY6FxIPp3Vg5EDWAxoXlmEFqxUqz1”
/storage/backups/encrypted/2018-11-18_11-10-09/

For more information about MySQL and MariaDB encryption, please check our another blog post.

Compression

Within the database cloud backup world, compression is one of your best friends. It can not only save storage space, but it can also significantly reduce the time required to download/upload data.
There are lots of compression tools available out there, namely gzip, bzip2, zip, rar, and 7z.
Normally, mysqldump can have best compression rates as it is a flat text file. Depending on the compression tool and ratio, a compressed mysqldump can be up to 6 times smaller than the original backup size. To compress the backup, you can pipe the mysqldump output to a compression tool and redirect it to a destination file. You can also skip several things like comments, lock tables statement (if InnoDB), skip GTID purged and triggers:

mysqldump --single-transaction --skip-comments --skip-triggers --skip-lock-tables --set-gtid-purged OFF --all-databases | gzip > /storage/backups/all-databases.sql.gz

With Percona Xtrabackup, you can use the streaming mode (innobackupex), which sends the backup to STDOUT in special tar or xbstream format instead of copying files to the backup directory. Having a compressed backup could save you up to 50% of the original backup size, depending on the dataset. Append the --compress option in the backup command. By using the xbstream in streaming backups, you can speed up the compression process by using the --compress-threads option. This option specifies the number of threads created by xtrabackup for parallel data compression. The default value for this option is 1. To use this feature, add the option to a local backup. An example backup with compression:

innobackupex --stream=xbstream --compress --compress-threads=4 > /storage/backups/backup.xbstream

Before applying logs during the preparation stage, compressed files will need to be
decompressed using xbstream:
Then, use qpress to extract each file ending with .qp in their respective directory before
running --apply-log command to prepare the MySQL data.

$ xbstream -x < /storage/backups/backup.xbstream

Limit network throughput

An great option for cloud backups is to limit network streaming bandwidth (Mb/s) when doing a backup. You can achieve that with pv tool. The pv utility comes with data modifiers option -L RATE, --rate-limit RATE which limit the transfer to a maximum of RATE bytes per second. Below example will restrict it to 2MB/s.

$ pv -q -L 2m

In below example, you can see xtrabackup with parallel gzip, encryption

 /usr/bin/innobackupex --defaults-file=/etc/mysql/my.cnf --galera-info --parallel 4 --stream=xbstream --no-timestamp . | pv -q -L 2m | pigz -9 - | openssl enc -aes-256-cbc -pass file:/var/tmp/cmon-008688-19992-72450efc3b6e9e4f.tmp > /home/ubuntu/backups/BACKUP-3445/backup-full-2018-11-28_213540.xbstream.gz.aes256 ) 2>&1.

Transfer backup to Cloud

Now when your backup is compressed and encrypted, it is ready for transfer.

Google cloud

The gsutil command line tool is used to manage, monitor and use your storage buckets on Google Cloud Storage. If you already installed the gcloud util, you already have the gsutil installed. Otherwise, follow the instructions for your Linux distribution from here.

To install the gcloud CLI you can follow below procedure:

curl https://sdk.cloud.google.com | bash

Restart your shell:

exec -l $SHELL

Run gcloud init to initialize the gcloud environment:

gcloud init

With the gsutil command line tool installed and authenticated, create a regional storage bucket named mysql-backups-storage in your current project.

gsutil mb -c regional -l europe-west1 gs://severalnines-storage/
Creating gs://mysql-backups-storage/

Amazon S3

If you are not using RDS to host your databases, it is very probable that you are doing your own backups. Amazon’s AWS platform, S3 (Amazon Simple Storage Service) is a data storage service that can be used to store database backups or other business critical files. Either it’s Amazon EC2 instance or your on-prem environment you can use the service to secure your data.

While backups can be uploaded through the web interface, the dedicated s3 command line interface can be used to do it from the command line and through backup automation scripts. If backups are to be kept for a very long time, and recovery time isn’t a concern, backups can be transferred to Amazon Glacier service, providing much cheaper long-term storage. Files (amazon objects) are logically stored in a huge flat container named bucket. S3 presents a REST interface to its internals. You can use this API to perform CRUD operations on buckets and objects, as well as to change permissions and configurations on both.

The primary distribution method for the AWS CLI on Linux, Windows, and macOS is pip, a package manager for Python. Instruction can be found here.

aws s3 cp severalnines.sql s3://severalnine-sbucket/mysql_backups

By default S3 provides eleven 9s object durability. It means that if you store 1.000.000.000 (1 billion) objects into it, you can expect to lose 1 object every 10 years on average. The way S3 achieves that impressive number of 9s is by replicating the object automatically in multiple Availability Zones, which we’ll talk about in another post. Amazon has regional datacenters all around the world.

Microsoft Azure Storage

Microsoft’s public cloud platform, Azure, has storage options with their control line interface. Information can be found here. The open-source, cross-platform Azure CLI provides a set of commands for working with the Azure platform. It gives much of the functionality seen in the Azure portal, including rich data access.

The installation of Azure CLI is fairly simple, you can find instructions here. Below you can find how to transfer your backup to Microsoft storage.

az storage blob upload --container-name severalnines --file severalnines.sql --name severalnines_backup
ClusterControl
Single Console for Your Entire Database Infrastructure
Find out what else is new in ClusterControl

Hybrid Storage for MySQL and MariaDB backups

With the growing public and private cloud storage industry, we have a new category called hybrid storage. This technology allows the files to be stored locally, with changes automatically synced to remote in the cloud. Such an approach is coming from the need of having recent backups stored locally for fast restore (lower RTO), as well as business continuity objectives.
The important aspect of efficient resource usage is to have separate backup retentions. Data that is stored locally, on redundant disk drives would be kept for a shorter period while cloud backup storage would be held for a longer time. Many times the requirement for longer backup retention comes from legal obligations for different industries (like telecoms having to store connection metadata). Cloud providers like Google Cloud Services, Microsoft Azure and Amazon S3 each offer virtually unlimited storage, decreasing local space needs. It allows you to retain your backup files longer, for as long as you would like and not have concerns around local disk space.

ClusterControl backup management - hybrid storage

When scheduling backup with ClusterControl, each of the backup methods are configurable with a set of options on how you want the backup to be executed. The most important for the hybrid cloud storage would be:

  • Network throttling
  • Encryption with the build in key management
  • Compression
  • Retention period for the local backups
  • Retention period for the cloud backups
ClusterControl dual backup retention
ClusterControl advanced backup features for cloud, parallel compression, network bandwitch limit, encryption etc ...

Conclusion

The cloud has changed the data backup industry. Because of its affordable price point, smaller businesses have an offsite solution that backs up all of their data.

Your company can take advantage of cloud scalability and pay-as-you-go pricing for growing storage needs. You can design a backup strategy to provide both local copies in the datacenter for immediate restoration, and a seamless gateway to cloud storage services from AWS, Google and Azure.

Advanced TLS and AES 256-bit encryption and compression features support secure backups that take up significantly less space in the cloud.

Database Backup Encryption - Best Practices

$
0
0

Offsite backup storage should be a critical part of any organisation’s disaster recovery plan. The ability to store data in a separate physical location, where it could survive a catastrophic event which destroys all the data in your primary data center, ensures your data survival and continuity of your organisation. A Cloud storage service is quite a good method to store offsite backups. No matter if you are using a cloud provider or if you are just copying data to an external data center, the backup encryption is a must in such cases. In one of our previous blogs, we discussed several methods of encrypting your backups. Today we will focus on some best practices around backup encryption.

Ensure that your secrets are safe

To encrypt and decrypt your data you have to use some sort of a password or a key. Depending on the encryption method (symmetrical or asymmetrical), it can be one secret for both encryption and decryption or it can be a public key for encryption and a private key for decryption. What is important, you should keep those safe. If you happen to use asymmetric encryption, you should focus on the private key, the one you will use for decrypting backups.

You can store keys in a key management system or a vault - there are numerous options on the market to pick from like Amazon’s KMS or Hashicorp’s Vault. Even if you decide not to use those solutions, you still should apply generic security practices like to ensure that only the correct users can access your keys and passwords. You should also consider preparing your backup scripts in a way that you will not expose keys or passwords in the list of running processes. Ideally, put them in the file instead of passing them as an argument to some commands.

Consider asymmetric encryption

The main difference between symmetric and asymmetric encryption is that while using symmetric encryption for both encryption and decryption, you use a single key or password. This requires higher security standards on both ends of the process. You have to make sure that the host on which you encrypt the data is very secure as a leak of the symmetric encryption key will allow the access to all of your encrypted backups.

On the other hand, if you use asymmetric encryption, you have two keys: the public key for encrypting the data and the private key for decryption. This makes things so much easier - you don’t really have to care about the public key. Even if it would be compromised, it will still not allow for any kind of access to the data from backups. You have to focus on the security of the private key only. It is easier - you are most likely encrypting backups on a daily basis (if not more frequent) while restore happens from time to time, making it feasible to store the private key in more secure location (even on a dedicated physical device). Below is a very quick example on how you can use gpg to generate a key pair and use it to encrypt data.

First, you have to generate the keys:

root@vagrant:~# gpg --gen-key
gpg (GnuPG) 1.4.20; Copyright (C) 2015 Free Software Foundation, Inc.
This is free software: you are free to change and redistribute it.
There is NO WARRANTY, to the extent permitted by law.

gpg: directory `/root/.gnupg' created
gpg: new configuration file `/root/.gnupg/gpg.conf' created
gpg: WARNING: options in `/root/.gnupg/gpg.conf' are not yet active during this run
gpg: keyring `/root/.gnupg/secring.gpg' created
gpg: keyring `/root/.gnupg/pubring.gpg' created
Please select what kind of key you want:
   (1) RSA and RSA (default)
   (2) DSA and Elgamal
   (3) DSA (sign only)
   (4) RSA (sign only)
Your selection?
RSA keys may be between 1024 and 4096 bits long.
What keysize do you want? (2048) 4096
Requested keysize is 4096 bits
Please specify how long the key should be valid.
         0 = key does not expire
      <n>  = key expires in n days
      <n>w = key expires in n weeks
      <n>m = key expires in n months
      <n>y = key expires in n years
Key is valid for? (0)
Key does not expire at all
Is this correct? (y/N) y

You need a user ID to identify your key; the software constructs the user ID
from the Real Name, Comment and Email Address in this form:
    "Heinrich Heine (Der Dichter) <heinrichh@duesseldorf.de>"

Real name: Krzysztof Ksiazek
Email address: my@backups.cc
Comment: Backup key
You selected this USER-ID:
    "Krzysztof Ksiazek (Backup key) <my@backups.cc>"

Change (N)ame, (C)omment, (E)mail or (O)kay/(Q)uit? o
You need a Passphrase to protect your secret key.

This created both public and private keys. Next, you want to export your public key to use for encrypting the data:

gpg --armor --export my@backups.cc > mybackupkey.asc

Next, you can use it to encrypt your backup.

root@vagrant:~# xtrabackup  --backup --stream=xbstream  | gzip | gpg -e --armor -r my@backups.cc -o /backup/pgp_encrypted.backup

Finally, an example how you can use your primary key (in this case it’s stored in the local key ring) to decrypt your backups:

root@vagrant:/backup# gpg -d /backup/pgp_encrypted.backup | gunzip | xbstream -x
encryption: using gcrypt 1.6.5

You need a passphrase to unlock the secret key for
user: "Krzysztof Ksiazek (Backup key) <my@backups.cc>"
4096-bit RSA key, ID E047CD69, created 2018-11-19 (main key ID BC341551)

gpg: gpg-agent is not available in this session
gpg: encrypted with 4096-bit RSA key, ID E047CD69, created 2018-11-19
      "Krzysztof Ksiazek (Backup key) <my@backups.cc>"

Rotate your encryption keys

No matter what kind of encryption you implemented, symmetric or asymmetric, you have to think about the key rotation. First of all, it is very important to have a mechanism in place to rotate the keys. This might be useful in case of a security breach, and you would have to quickly change keys that you use for backup encryption and decryption. Of course, in case of a security breach, you need to consider what is going to happen with the old backups which were encrypted using compromised keys. They have been compromised although they still may be useful and required as per Recovery Point Objective. There are couple of options including re-encrypting them or moving them to a non-compromised localization.

Speed up the encryption process by parallelizing it

If you have an option to implement parallelization of the encryption process, consider it. Encryption performance mostly depends on the CPU power, thus allowing more CPU cores to work in parallel to encrypt the file should result in much smaller encryption times. Some of the encryption tools give such option. One of them is xtrabackup which has an option to use embedded encryption and parallelize the process.

What you are looking for is either “--encrypt-key” or “--encrypt-key-file” options which enable embedded encryption. While doing that you can also define “--encrypt-threads” and “--encrypt-chunk-size”. Second increases a working buffer for encryption, first defines how many threads should be used for encryption.

Of course, this is just one of the solutions you can implement. You can achieve this using shell tools. An example below:

root@vagrant:~# files=2 ; mariabackup --user=root --backup --pass=pass --stream=xbstream  |split -b 60M - backup ; ls backup* |  parallel -j ${files} --workdir "$(pwd)"'echo "encrypting {}" ; openssl  enc -aes-256-cbc -salt -in "{}" -k mypass > "111{}"'

This is by no means a perfect solution as you have to know in advance how big, more or less, the backup will be to split it to predefined number of files matching the parallelization level you want to achieve (if you want to use 2 CPU cores, you should have two files, if you want to use 4 cores, 4 files etc). It also requires disk space that is twice the size of the backup, as at first it generates multiple files using split and then encryption creates another set of encrypted files. On the other hand, if your data set size is acceptable and you would like to improve encryption performance, that’s an option you can consider. To decrypt the backup you will have to decrypt each of the individual files and then use ‘cat’ to join them together.

Test your backups

No matter how you are going to implement the backup encryption, you have to test it. First of all, all backups have to be tested, encrypted or not. Backups may not be complete, or may suffer from some type of corruption. You cannot be sure that your backup can be restored until you actually perform the restore. That’s why regular backup verification is a must. Encryption adds more complexity to the backup process. Issues may show up at the encryption time, again - bugs or glitches may corrupt the encrypted files. Once encrypted, the question is then if it is possible to decrypt it and restore?

You should have a restore test process in place. Ideally, the restore test would be executed after each backup. As a minimum, you should test your backups a couple of times per year. Definitely you have to test it as soon as a change in the backup process had been introduced. Have you added compression to the backup? Did you change the encryption method? Did you rotate the encryption key? All of those actions may have some impact on your ability to actually restore your backup. Therefore you should make sure you test the whole process after every change.

ClusterControl can automate the verification process, both on demand or scheduled after every backup.

To verify an existing backup, you just need to pick the one from the list, click on “Restore” option and then go through the restore wizard. First, you need to verify which backup you want to restore.

Then, on the next step, you should pick the restore and verify option.

You need to pass some information about the host on which you want to test the restore. It has to be accessible via SSH from the ClusterControl instance. You may decide to keep the restore test server up and running (and then dump some partial data from it if you wanted to go for a partial restore) or shut it down.

The final step is all about verifying if you made the correct choices. If yes, you can start the backup verification job.

If the verification completed successfully, you will see that the backup is marked as verified on the list of the backups.

If you want to automate this process, it is also possible with ClusterControl. When scheduling the backup you can enable backup verification:

This adds another step in the backup scheduling wizard.

Here you again have to define the host which you want to use for backup restore tests, decide if you want to install the software on it (or maybe you already have it done), if you want to keep the restore server up and whether you want to test the backup immediately after it is completed or maybe you want to wait a bit.

MySQL on Docker: Multiple Delayed Replication Slaves for Disaster Recovery with Low RTO

$
0
0

Delayed replication allows a replication slave to deliberately lag behind the master by at least a specified amount of time. Before executing an event, the slave will first wait, if necessary, until the given time has passed since the event was created on the master. The result is that the slave will reflect the state of the master some time back in the past. This feature is supported since MySQL 5.6 and MariaDB 10.2.3. It can come in handy in case of accidental data deletion, and should be part of your disaster recovery plan.

The problem when setting up a delayed replication slave is how much delay we should put on. Too short of time and you risk the bad query getting to your delayed slave before you can get to it, thus wasting the point of having the delayed slave. Optionally, you can have your delayed time to be so long that it take hours for your delayed slave to catch up to where the master was at the time of the error.

Luckily with Docker, process isolation is its strength. Running multiple MySQL instances is pretty convenient with Docker. It allows us to have multiple delayed slaves within a single physical host to improve our recovery time and save hardware resources. If you think a 15-minute delay is too short, we can have another instance with 1-hour delay or 6-hour for an even older snapshot of our database.

In this blog post, we are going to deploy multiple MySQL delayed slaves on one single physical host with Docker, and show some recovery scenarios. The following diagram illustrates our final architecture that we want to build:

Our architecture consists of an already deployed 2-node MySQL Replication running on physical servers (blue) and we would like to set up another three MySQL slaves (green) with following behaviour:

  • 15 minutes delay
  • 1 hour delay
  • 6 hours delay

Take note that we are going to have 3 copies of the exact same data on the same physical server. Ensure our Docker host has the storage required, so do allocate sufficient disk space beforehand.

MySQL Master Preparation

Firstly, login to the master server and create the replication user:

mysql> GRANT REPLICATION SLAVE ON *.* TO rpl_user@'%' IDENTIFIED BY 'YlgSH6bLLy';

Then, create a PITR-compatible backup on the master:

$ mysqldump -uroot -p --flush-privileges --hex-blob --opt --master-data=1 --single-transaction --skip-lock-tables --skip-lock-tables --triggers --routines --events --all-databases | gzip -6 -c > mysqldump_complete.sql.gz

If you are using ClusterControl, you can make a PITR-compatible backup easily. Go to Backups -> Create Backup and pick "Complete PITR-compatible" under the "Dump Type" dropdown:

Finally, transfer this backup to the Docker host:

$ scp mysqldump_complete.sql.gz root@192.168.55.200:~

This backup file will be used by the MySQL slave containers during the slave bootstrapping process, as shown in the next section.

Delayed Slave Deployment

Prepare our Docker container directories. Create 3 directories (mysql.conf.d, datadir and sql) for every MySQL container that we are going to launch (you can use loop to simplify the commands below):

$ mkdir -p /storage/mysql-slave-15m/mysql.conf.d
$ mkdir -p /storage/mysql-slave-15m/datadir
$ mkdir -p /storage/mysql-slave-15m/sql
$ mkdir -p /storage/mysql-slave-1h/mysql.conf.d
$ mkdir -p /storage/mysql-slave-1h/datadir
$ mkdir -p /storage/mysql-slave-1h/sql
$ mkdir -p /storage/mysql-slave-6h/mysql.conf.d
$ mkdir -p /storage/mysql-slave-6h/datadir
$ mkdir -p /storage/mysql-slave-6h/sql

"mysql.conf.d" directory will store our custom MySQL configuration file and will be mapped into the container under /etc/mysql.conf.d. "datadir" is where we want Docker to store the MySQL data directory, which maps to /var/lib/mysql of the container and "sql" directory stores our SQL files - backup files in .sql or .sql.gz format to stage the slave before replicating and also .sql files to automate the replication configuration and startup.

15-minute Delayed Slave

Prepare the MySQL configuration file for our 15-minute delayed slave:

$ vim /storage/mysql-slave-15m/mysql.conf.d/my.cnf

And add the following lines:

[mysqld]
server_id=10015
binlog_format=ROW
log_bin=binlog
log_slave_updates=1
gtid_mode=ON
enforce_gtid_consistency=1
relay_log=relay-bin
expire_logs_days=7
read_only=ON

** The server-id value we used for this slave is 10015.

Next, under /storage/mysql-slave-15m/sql directory, create two SQL files, one to RESET MASTER (1reset_master.sql) and another one to establish the replication link using CHANGE MASTER statement (3setup_slave.sql).

Create a text file 1reset_master.sql and add the following line:

RESET MASTER;

Create a text file 3setup_slave.sql and add the following lines:

CHANGE MASTER TO MASTER_HOST = '192.168.55.171', MASTER_USER = 'rpl_user', MASTER_PASSWORD = 'YlgSH6bLLy', MASTER_AUTO_POSITION = 1, MASTER_DELAY=900;
START SLAVE;

MASTER_DELAY=900 is equal to 15 minutes (in seconds). Then copy the backup file taken from our master (that has been transferred into our Docker host) to the "sql" directory and renamed it as 2mysqldump_complete.sql.gz:

$ cp ~/mysqldump_complete.tar.gz /storage/mysql-slave-15m/sql/2mysqldump_complete.tar.gz

The final look of our "sql" directory should be something like this:

$ pwd
/storage/mysql-slave-15m/sql
$ ls -1
1reset_master.sql
2mysqldump_complete.sql.gz
3setup_slave.sql

Take note that we prefix the SQL filename with an integer to determine the execution order when Docker initializes the MySQL container.

Once everything is in place, run the MySQL container for our 15-minute delayed slave:

$ docker run -d \
--name mysql-slave-15m \
-e MYSQL_ROOT_PASSWORD=password \
--mount type=bind,source=/storage/mysql-slave-15m/datadir,target=/var/lib/mysql \
--mount type=bind,source=/storage/mysql-slave-15m/mysql.conf.d,target=/etc/mysql/mysql.conf.d \
--mount type=bind,source=/storage/mysql-slave-15m/sql,target=/docker-entrypoint-initdb.d \
mysql:5.7

** The MYSQL_ROOT_PASSWORD value must be the same as the MySQL root password on the master.

The following lines are what we are looking for to verify if MySQL is running correctly and connected as a slave to our master (192.168.55.171):

$ docker logs -f mysql-slave-15m
...
2018-12-04T04:05:24.890244Z 0 [Note] mysqld: ready for connections.
Version: '5.7.24-log'  socket: '/var/run/mysqld/mysqld.sock'  port: 3306  MySQL Community Server (GPL)
2018-12-04T04:05:25.010032Z 2 [Note] Slave I/O thread for channel '': connected to master 'rpl_user@192.168.55.171:3306',replication started in log 'FIRST' at position 4

You can then verify the replication status with following statement:

$ docker exec -it mysql-slave-15m mysql -uroot -p -e 'show slave status\G'
...
             Slave_IO_Running: Yes
            Slave_SQL_Running: Yes
                    SQL_Delay: 900
                Auto_Position: 1
...

At this point, our 15-minute delayed slave container is replicating correctly and our architecture is looking something like this:

1-hour Delayed Slave

Prepare the MySQL configuration file for our 1-hour delayed slave:

$ vim /storage/mysql-slave-1h/mysql.conf.d/my.cnf

And add the following lines:

[mysqld]
server_id=10060
binlog_format=ROW
log_bin=binlog
log_slave_updates=1
gtid_mode=ON
enforce_gtid_consistency=1
relay_log=relay-bin
expire_logs_days=7
read_only=ON

** The server-id value we used for this slave is 10060.

Next, under /storage/mysql-slave-1h/sql directory, create two SQL files, one to RESET MASTER (1reset_master.sql) and another one to establish the replication link using CHANGE MASTER statement (3setup_slave.sql).

Create a text file 1reset_master.sql and add the following line:

RESET MASTER;

Create a text file 3setup_slave.sql and add the following lines:

CHANGE MASTER TO MASTER_HOST = '192.168.55.171', MASTER_USER = 'rpl_user', MASTER_PASSWORD = 'YlgSH6bLLy', MASTER_AUTO_POSITION = 1, MASTER_DELAY=3600;
START SLAVE;

MASTER_DELAY=3600 is equal to 1 hour (in seconds). Then copy the backup file taken from our master (that has been transferred into our Docker host) to the "sql" directory and renamed it as 2mysqldump_complete.sql.gz:

$ cp ~/mysqldump_complete.tar.gz /storage/mysql-slave-1h/sql/2mysqldump_complete.tar.gz

The final look of our "sql" directory should be something like this:

$ pwd
/storage/mysql-slave-1h/sql
$ ls -1
1reset_master.sql
2mysqldump_complete.sql.gz
3setup_slave.sql

Take note that we prefix the SQL filename with an integer to determine the execution order when Docker initializes the MySQL container.

Once everything is in place, run the MySQL container for our 1-hour delayed slave:

$ docker run -d \
--name mysql-slave-1h \
-e MYSQL_ROOT_PASSWORD=password \
--mount type=bind,source=/storage/mysql-slave-1h/datadir,target=/var/lib/mysql \
--mount type=bind,source=/storage/mysql-slave-1h/mysql.conf.d,target=/etc/mysql/mysql.conf.d \
--mount type=bind,source=/storage/mysql-slave-1h/sql,target=/docker-entrypoint-initdb.d \
mysql:5.7

** The MYSQL_ROOT_PASSWORD value must be the same as the MySQL root password on the master.

The following lines are what we are looking for to verify if MySQL is running correctly and connected as a slave to our master (192.168.55.171):

$ docker logs -f mysql-slave-1h
...
2018-12-04T04:05:24.890244Z 0 [Note] mysqld: ready for connections.
Version: '5.7.24-log'  socket: '/var/run/mysqld/mysqld.sock'  port: 3306  MySQL Community Server (GPL)
2018-12-04T04:05:25.010032Z 2 [Note] Slave I/O thread for channel '': connected to master 'rpl_user@192.168.55.171:3306',replication started in log 'FIRST' at position 4

You can then verify the replication status with following statement:

$ docker exec -it mysql-slave-1h mysql -uroot -p -e 'show slave status\G'
...
             Slave_IO_Running: Yes
            Slave_SQL_Running: Yes
                    SQL_Delay: 3600
                Auto_Position: 1
...

At this point, our 15-minute and 1-hour MySQL delayed slave containers are replicating from the master and our architecture is looking something like this:

6-hour Delayed Slave

Prepare the MySQL configuration file for our 6-hour delayed slave:

$ vim /storage/mysql-slave-15m/mysql.conf.d/my.cnf

And add the following lines:

[mysqld]
server_id=10006
binlog_format=ROW
log_bin=binlog
log_slave_updates=1
gtid_mode=ON
enforce_gtid_consistency=1
relay_log=relay-bin
expire_logs_days=7
read_only=ON

** The server-id value we used for this slave is 10006.

Next, under /storage/mysql-slave-6h/sql directory, create two SQL files, one to RESET MASTER (1reset_master.sql) and another one to establish the replication link using CHANGE MASTER statement (3setup_slave.sql).

Create a text file 1reset_master.sql and add the following line:

RESET MASTER;

Create a text file 3setup_slave.sql and add the following lines:

CHANGE MASTER TO MASTER_HOST = '192.168.55.171', MASTER_USER = 'rpl_user', MASTER_PASSWORD = 'YlgSH6bLLy', MASTER_AUTO_POSITION = 1, MASTER_DELAY=21600;
START SLAVE;

MASTER_DELAY=21600 is equal to 6 hours (in seconds). Then copy the backup file taken from our master (that has been transferred into our Docker host) to the "sql" directory and renamed it as 2mysqldump_complete.sql.gz:

$ cp ~/mysqldump_complete.tar.gz /storage/mysql-slave-6h/sql/2mysqldump_complete.tar.gz

The final look of our "sql" directory should be something like this:

$ pwd
/storage/mysql-slave-6h/sql
$ ls -1
1reset_master.sql
2mysqldump_complete.sql.gz
3setup_slave.sql

Take note that we prefix the SQL filename with an integer to determine the execution order when Docker initializes the MySQL container.

Once everything is in place, run the MySQL container for our 6-hour delayed slave:

$ docker run -d \
--name mysql-slave-6h \
-e MYSQL_ROOT_PASSWORD=password \
--mount type=bind,source=/storage/mysql-slave-6h/datadir,target=/var/lib/mysql \
--mount type=bind,source=/storage/mysql-slave-6h/mysql.conf.d,target=/etc/mysql/mysql.conf.d \
--mount type=bind,source=/storage/mysql-slave-6h/sql,target=/docker-entrypoint-initdb.d \
mysql:5.7

** The MYSQL_ROOT_PASSWORD value must be the same as the MySQL root password on the master.

The following lines are what we are looking for to verify if MySQL is running correctly and connected as a slave to our master (192.168.55.171):

$ docker logs -f mysql-slave-6h
...
2018-12-04T04:05:24.890244Z 0 [Note] mysqld: ready for connections.
Version: '5.7.24-log'  socket: '/var/run/mysqld/mysqld.sock'  port: 3306  MySQL Community Server (GPL)
2018-12-04T04:05:25.010032Z 2 [Note] Slave I/O thread for channel '': connected to master 'rpl_user@192.168.55.171:3306',replication started in log 'FIRST' at position 4

You can then verify the replication status with following statement:

$ docker exec -it mysql-slave-6h mysql -uroot -p -e 'show slave status\G'
...
             Slave_IO_Running: Yes
            Slave_SQL_Running: Yes
                    SQL_Delay: 21600
                Auto_Position: 1
...

At this point, our 5 minutes, 1-hour and 6-hour delayed slave containers are replicating correctly and our architecture is looking something like this:

Disaster Recovery Scenario

Let's say a user has accidentally dropped a wrong column on a big table. Consider the following statement was executed on the master:

mysql> USE shop;
mysql> ALTER TABLE settings DROP COLUMN status;

If you are lucky enough to realize it immediately, you could use the 15-minute delayed slave to catch up to the moment before the disaster happens and promote it to become master, or export the missing data out and restore it on the master.

Firstly, we have to find the binary log position before the disaster happened. Grab the time now() on the master:

mysql> SELECT now();
+---------------------+
| now()               |
+---------------------+
| 2018-12-04 14:55:41 |
+---------------------+

Then, get the active binary log file on the master:

mysql> SHOW MASTER STATUS;
+---------------+----------+--------------+------------------+---------------------------------------------------------------------------------------------------------------------------------------------------------------------------------------+
| File          | Position | Binlog_Do_DB | Binlog_Ignore_DB | Executed_Gtid_Set                                                                                                                                                                     |
+---------------+----------+--------------+------------------+---------------------------------------------------------------------------------------------------------------------------------------------------------------------------------------+
| binlog.000004 | 20260658 |              |                  | 1560665e-ed2b-11e8-93fa-000c29b7f985:1-12031,
1b235f7a-d37b-11e8-9c3e-000c29bafe8f:1-62519,
1d8dc60a-e817-11e8-82ff-000c29bafe8f:1-326575,
791748b3-d37a-11e8-b03a-000c29b7f985:1-374 |
+---------------+----------+--------------+------------------+---------------------------------------------------------------------------------------------------------------------------------------------------------------------------------------+

Using the same date format, extract the information that we want from the binary log, binlog.000004. We estimate the start time to read from the binlog around 20 minutes ago (2018-12-04 14:35:00) and filter the output to show 25 lines before the "drop column" statement:

$ mysqlbinlog --start-datetime="2018-12-04 14:35:00" --stop-datetime="2018-12-04 14:55:41" /var/lib/mysql/binlog.000004 | grep -i -B 25 "drop column"'/*!*/;
# at 19379172
#181204 14:54:45 server id 1  end_log_pos 19379232 CRC32 0x0716e7a2     Table_map: `shop`.`settings` mapped to number 766
# at 19379232
#181204 14:54:45 server id 1  end_log_pos 19379460 CRC32 0xa6187edd     Write_rows: table id 766 flags: STMT_END_F

BINLOG '
tSQGXBMBAAAAPAAAACC0JwEAAP4CAAAAAAEABnNidGVzdAAHc2J0ZXN0MgAFAwP+/gME/nj+PBCi
5xYH
tSQGXB4BAAAA5AAAAAS1JwEAAP4CAAAAAAEAAgAF/+AYwwAAysYAAHc0ODYyMjI0NjI5OC0zNDE2
OTY3MjY5OS02MDQ1NTQwOTY1Ny01MjY2MDQ0MDcwOC05NDA0NzQzOTUwMS00OTA2MTAxNzgwNC05
OTIyMzM3NzEwOS05NzIwMzc5NTA4OC0yODAzOTU2NjQ2MC0zNzY0ODg3MTYzOTswMTM0MjAwNTcw
Ni02Mjk1ODMzMzExNi00NzQ1MjMxODA1OS0zODk4MDQwMjk5MS03OTc4MTA3OTkwNQEAAADdfhim
'/*!*/;
# at 19379460
#181204 14:54:45 server id 1  end_log_pos 19379491 CRC32 0x71f00e63     Xid = 622405
COMMIT/*!*/;
# at 19379491
#181204 14:54:46 server id 1  end_log_pos 19379556 CRC32 0x62b78c9e     GTID    last_committed=11507    sequence_number=11508   rbr_only=no
SET @@SESSION.GTID_NEXT= '1560665e-ed2b-11e8-93fa-000c29b7f985:11508'/*!*/;
# at 19379556
#181204 14:54:46 server id 1  end_log_pos 19379672 CRC32 0xc222542a     Query   thread_id=3162  exec_time=1     error_code=0
SET TIMESTAMP=1543906486/*!*/;
/*!\C utf8 *//*!*/;
SET @@session.character_set_client=33,@@session.collation_connection=33,@@session.collation_server=8/*!*/;
ALTER TABLE settings DROP COLUMN status

In the bottom few lines of the mysqlbinlog output, you should have the erroneous command that was executed at position 19379556. The position that we should restore is one step before this, which is in position 19379491. This is the binlog position where we want our delayed slave to be up to.

Then, on the chosen delayed slave, stop the delayed replication slave and start again the slave to a fixed end position that we figured out above:

$ docker exec -it mysql-slave-15m mysql -uroot -p
mysql> STOP SLAVE;
mysql> START SLAVE UNTIL MASTER_LOG_FILE = 'binlog.000004', MASTER_LOG_POS = 19379491;

Monitor the replication status and wait until Exec_Master_Log_Pos is equal to Until_Log_Pos value. This could take some time. Once caught up, you should see the following:

$ docker exec -it mysql-slave-15m mysql -uroot -p -e 'SHOW SLAVE STATUS\G'
... 
          Exec_Master_Log_Pos: 19379491
              Relay_Log_Space: 50552186
              Until_Condition: Master
               Until_Log_File: binlog.000004
                Until_Log_Pos: 19379491
...

Finally verify if the missing data that we were looking for is there (column "status" still exists):

mysql> DESCRIBE shop.settings;
+--------+------------------+------+-----+---------+----------------+
| Field  | Type             | Null | Key | Default | Extra          |
+--------+------------------+------+-----+---------+----------------+
| id     | int(10) unsigned | NO   | PRI | NULL    | auto_increment |
| sid    | int(10) unsigned | NO   | MUL | 0       |                |
| param  | varchar(100)     | NO   |     |         |                |
| value  | varchar(255)     | NO   |     |         |                |
| status | int(11)          | YES  |     | 1       |                |
+--------+------------------+------+-----+---------+----------------+

Then export the table from our slave container and transfer it to the master server:

$ docker exec -it mysql-slave-1h mysqldump -uroot -ppassword --single-transaction shop settings > shop_settings.sql

Drop the problematic table and restore it back on the master:

$ mysql -uroot -p -e 'DROP TABLE shop.settings'
$ mysqldump -uroot -p -e shop < shop_setttings.sql

We have now recovered our table back to its original state before the disastrous event. To summarize, delayed replication can be used for several purposes:

  • To protect against user mistakes on the master. A DBA can roll back a delayed slave to the time just before the disaster.
  • To test how the system behaves when there is a lag. For example, in an application, a lag might be caused by a heavy load on the slave. However, it can be difficult to generate this load level. Delayed replication can simulate the lag without having to simulate the load. It can also be used to debug conditions related to a lagging slave.
  • To inspect what the database looked like in the past, without having to reload a backup. For example, if the delay is one week and the DBA needs to see what the database looked like before the last few days' worth of development, the delayed slave can be inspected.

Final Thoughts

With Docker, running multiple MySQL instances on a same physical host can be done efficiently. You may use Docker orchestration tools like Docker Compose and Swarm to simplify the multi-container deployment as opposed to the steps shown in this blog post.

MySQL & MariaDB Query Caching with ProxySQL & ClusterControl

$
0
0

Queries have to be cached in every heavily loaded database, there is simply no way for a database to handle all traffic with reasonable performance. There are various mechanisms in which a query cache can be implemented. Starting from the MySQL query cache, which used to work just fine for mostly read-only, low concurrency workloads and which has no place in high concurrent workloads (to the extent that Oracle removed it in MySQL 8.0), to external key-value stores like Redis, memcached or CouchBase.

The main problem with using an external dedicated data store (as we would not recommend to use MySQL query cache to anyone) is that this is yet another datastore to manage. It is yet another environment to maintain, scaling issues to handle, bugs to debug and so on.

So why not kill two birds with one stone by leveraging your proxy? The assumption here is that you are using a proxy in your production environment, as it helps load balance queries across instances, and mask the underlying database topology by provide a simple endpoint to applications. ProxySQL is a great tool for the job, as it can additionally function as a caching layer. In this blog post, we’ll show you how to cache queries in ProxySQL using ClusterControl.

How Query Cache Works in ProxySQL?

First of all, a bit of a background. ProxySQL manages traffic through query rules and it can accomplish query caching using the same mechanism. ProxySQL stores cached queries in a memory structure. Cached data is evicted using time-to-live (TTL) setting. TTL can be defined for each query rule individually so it is up to the user to decide if query rules are to be defined for each individual query, with distinct TTL or if she just needs to create a couple of rules which will match the majority of the traffic.

There are two configuration settings that define how a query cache should be used. First, mysql-query_cache_size_MB which defines a soft limit on the query cache size. It is not a hard limit so ProxySQL may use slightly more memory than that, but it is enough to keep the memory utilization under control. Second setting you can tweak is mysql-query_cache_stores_empty_result. It defines if an empty result set is cached or not.

ProxySQL query cache is designed as a key-value store. The value is the result set of a query and the key is composed from concatenated values like: user, schema and query text. Then a hash is created off that string and that hash is used as the key.

Setting up ProxySQL as a Query Cache Using ClusterControl

As the initial setup, we have a replication cluster of one master and one slave. We also have a single ProxySQL.

This is by no means a production-grade setup as we would have to implement some sort of high availability for the proxy layer (for example by deploying more than one ProxySQL instance, and then keepalived on top of them for floating Virtual IP), but it will be more than enough for our tests.

First, we are going to verify the ProxySQL configuration to make sure query cache settings are what we want them to be.

256 MB of query cache should be about right and we want to cache also the empty result sets - sometimes a query which returns no data still have to do a lot of work to verify there’s nothing to return.

Next step is to create query rules which will match the queries you want to cache. There are two ways to do that in ClusterControl.

Manually Adding Query Rules

First way requires a bit more manual actions. Using ClusterControl you can easily create any query rule you want, including query rules that do the caching. First, let’s take a look at the list of the rules:

At this point, we have a set of query rules to perform the read/write split. The first rule has an ID of 100. Our new query rule has to be processed before that one so we will use lower rule ID. Let’s create a query rule which will do the caching of queries similar to this one:

SELECT DISTINCT c FROM sbtest8 WHERE id BETWEEN 5041 AND 5140 ORDER BY c

There are three ways of matching the query: Digest, Match Digest and Match Pattern. Let’s talk a bit about them here. First, Match Digest. We can set here a regular expression that will match a generalized query string that represents some query type. For example, for our query:

SELECT DISTINCT c FROM sbtest8 WHERE id BETWEEN 5041 AND 5140 ORDER BY c

The generic representation will be:

SELECT DISTINCT c FROM sbtest8 WHERE id BETWEEN ? AND ? ORDER BY c

As you can see, it stripped the arguments to the WHERE clause therefore all queries of this type are represented as a single string. This option is quite nice to use because it matches whole query type and, what’s even more important, it’s stripped off any whitespaces. This makes it so much easier to write a regular expression as you don’t have to account for weird line breaks, whitespaces at the beginning or end of the string and so on.

Digest is basically a hash that ProxySQL calculates over the Match Digest form.

Finally, Match Pattern matches against full query text, as it was sent by the client. In our case, the query will have a form of:

SELECT DISTINCT c FROM sbtest8 WHERE id BETWEEN 5041 AND 5140 ORDER BY c

We are going to use Match Digest as we want all of those queries to be covered by the query rule. If we wanted to cache just that particular query, a good option would be to use Match Pattern.

The regular expression that we use is:

SELECT DISTINCT c FROM sbtest[0-9]+ WHERE id BETWEEN \? AND \? ORDER BY c

We are matching literally the exact generalized query string with one exception - we know that this query hit multiple tables therefore we added a regular expression to match all of them.

Once this is done, we can see if the query rule is in effect or not.

We can see that ‘Hits’ are increasing which means that our query rule is being used. Next, we’ll look at another way to create a query rule.

Using ClusterControl to Create Query Rules

ProxySQL has a useful functionality of collecting statistics of the queries it routed. You can track data like execution time, how many times a given query was executed and so on. This data is also present in ClusterControl:

What is even better, if you point on a given query type, you can create a query rule related to it. You can also easily cache this particular query type.

As you can see, some of the data like Rule IP, Cache TTL or Schema Name are already filled. ClusterControl will also fill data based on which matching mechanism you decided to use. We can easily use either hash for a given query type or we can use Match Digest or Match Pattern if we would like to fine-tune the regular expression (for example doing the same as we did earlier and extending the regular expression to match all the tables in sbtest schema).

This is all you need to easily create query cache rules in ProxySQL. Download ClusterControl to try it today.


How to Improve Replication Performance in a MySQL or MariaDB Galera Cluster

$
0
0

In the comments section of one of our blogs a reader asked about the impact of wsrep_slave_threads on Galera Cluster’s I/O performance and scalability. At that time, we couldn’t easily answer that question and back it up with more data, but finally we managed to set up the environment and run some tests.

Our reader pointed towards benchmarks that showed that increasing wsrep_slave_threads did not have any impact on the performance of the Galera cluster.

To explain what the impact of that setting is, we set up a small cluster of three nodes (m5d.xlarge). This allowed us to utilize directly attached nvme SSD for the MySQL data directory. By doing this, we minimized the chance of storage becoming the bottleneck in our setup.

We set up InnoDB buffer pool to 8GB and redo logs to two files, 1GB each. We also increased innodb_io_capacity to 2000 and innodb_io_capacity_max to 10000. This was also intended to ensure that neither of those settings would impact our performance.

The whole problem with such benchmarks is that there are so many bottlenecks that you have to eliminate them one by one. Only after doing some configuration tuning and after making sure that the hardware will not be a problem, one can have hope that some more subtle limits will show up.

We generated ~90GB of data using sysbench:

sysbench /usr/share/sysbench/oltp_write_only.lua --threads=16 --events=0 --time=600 --mysql-host=172.30.4.245 --mysql-user=sbtest --mysql-password=sbtest --mysql-port=3306 --tables=28 --report-interval=1 --skip-trx=off --table-size=10000000 --db-ps-mode=disable --mysql-db=sbtest_large prepare

Then the benchmark was executed. We tested two settings: wsrep_slave_threads=1 and wsrep_slave_threads=16. The hardware was not powerful enough to benefit from increasing this variable even further. Please also keep in mind that we did not do a detailed benchmarking in order to determine whether wsrep_slave_threads should be set to 16, 8 or maybe 4 for the best performance. We were interested to see if we can show an impact on the cluster. And yes, the impact was clearly visible. For starters, some flow control graphs.

While running with wsrep_slave_threads=1, on average, nodes were paused due to flow control ~64% of the time.

While running with wsrep_slave_threads=16, on average, nodes were paused due to flow control ~20% of the time.

You can also compare the difference on a single graph. The drop at the end of the first part is the first attempt to run with wsrep_slave_threads=16. Servers ran out of disk space for binary logs and we had to re-run that benchmark once more at a later time.

How did this translate in performance terms? The difference is visible although definitely not that spectacular.

First, the query per second graph. First of all, you can notice that in both cases results are all over the place. This is mostly related to the unstable performance of the I/O storage and the flow control randomly kicking in. You can still see that the performance of the “red” result (wsrep_slave_threads=1) is quite lower than the “green” one (wsrep_slave_threads=16).

Quite similar picture is when we look at the latency. You can see more (and typically deeper) stalls for the run with wsrep_slave_thread=1.

ClusterControl
Single Console for Your Entire Database Infrastructure
Find out what else is new in ClusterControl

The difference is even more visible when we calculated average latency across all the runs and you can see that the latency of wsrep_slave_thread=1 is 27% higher of the latency with 16 slave threads, which obviously is not good as we want latency to be lower, not higher.

The difference in throughput is also visible, around 11% of the improvement when we added more wsrep_slave_threads.

As you can see, the impact is there. It is by no means 16x (even if that’s how we increased the number of slave threads in Galera) but it is definitely prominent enough so that we cannot classify it as just a statistical anomaly.

Please keep in mind that in our case we used quite small nodes. The difference should be even more significant if we are talking about large instances running on EBS volumes with thousands of provisioned IOPS.

Then we would be able to run sysbench even more aggressively, with higher number of concurrent operations. This should improve parallelization of the writesets, improving the gain from the multithreading even further. Also, faster hardware means that Galera will be able to utilize those 16 threads in more efficient way.

When running tests like this you have to keep in mind you need to push your setup almost to its limits. Single-threaded replication can handle quite a lot of load and you need to run heavy traffic to actually make it not performant enough to handle the task.

We hope this blog post gives you more insight into Galera Cluster’s abilities to apply writesets in parallel and the limiting factors around it.

Database High Availability Comparison - MySQL / MariaDB Replication vs Oracle Data Guard

$
0
0

In the “State of the Open-Source DBMS Market, 2018”, Gartner predicts that by 2022, 70 percent of new in-house applications will be developed on an open-source database. And 50% of existing commercial databases will have converted. So, Oracle DBAs, get ready to start deploying and managing new open source databases - along with your legacy Oracle instances. Unless you’re already doing it.

So how does MySQL or MariaDB replication stack up against Oracle Data Guard? In this blog, we’ll compare the two from the standpoint of a high availability database solution.

What To Look For

A modern data replication architecture is built upon flexible designs that enable unidirectional and bidirectional data replication, as well as quick, automated failover to secondary databases in the event of unplanned service break. Failover should be also easy to execute and reliable so no committed transactions would be lost. Moreover switchover or failover should ideally be transparent to applications.

Data replication solutions have to be capable to copy data with very low latency to avoid processing bottlenecks and guarantee real-time access to data. Real-time copies could be deployed on a different database running on low-cost hardware.

When used for disaster recovery, the system must be validated to ensure application access to the secondary system with minimal service interruption. The ideal solution should allow regular testing of the disaster recovery process.

Main Topics of Comparison

  • Data availability and consistency
    • Gtid, scm
    • Mention Replication to multiple standby, async + sync models
    • Isolation of standby from production faults (e.g. delayed replication for mysql)
    • Avoid loss of data (sync replication)
  • Standby systems utilization
    • Usage of the standby
  • Failover, Switchover and automatic recovery
    • Database failover
    • Transparent application failover (TAF vs ProxySQL, MaxScale)
  • Security
  • Ease of use and management (unified management of pre-integrated components)

Data Availability and Consistency

MySQL GTID

MySQL 5.5 replication was based on binary log events, where all a slave knew was the precise event and the exact position it just read from the master. Any single transaction from a master may have ended in various binary logs from different slaves, and the transaction would typically have different positions in these logs. It was a simple solution that came with limitations, topology changes could require an admin to stop replication on the instances involved. These changes could cause some other issues, e.g., a slave couldn’t be moved down the replication chain without a time-consuming rebuild. Fixing a broken replication link would require manually determining a new binary log file and position of the last transaction executed on the slave and resuming from there, or a total rebuild. We’ve all had to work around these limitations while dreaming about a global transaction identifier.

MySQL version 5.6 (and MariaDB version 10.0.2) introduced a mechanism to solve this problem. GTID (Global Transaction Identifier) provides better transactions mapping across nodes.

With GTID, slaves can see a unique transaction coming in from several masters and this can easily be mapped into the slave execution list if it needs to restart or resume replication. So, the advice is to always use GTID. Note that MySQL and MariaDB have different GTID implementations.

Oracle SCN

In 1992 with the release 7.3 Oracle introduced a solution to keep a synchronized copy of a database as standby, know as Data Guard from version 9i release 2. A Data Guard configuration consists of two main components, a single primary database, and a standby database (up to 30). Changes on the primary database are passed through the standby database, and these changes are applied to the standby database to keep it synchronized.

Oracle Data Guard is initially created from a backup of the primary database. Data Guard automatically synchronizes the primary database and all standby databases by transmitting primary database redo - the information used by every Oracle Database to protect transactions - and applying it to the standby database. Oracle uses an internal mechanism called SCN (System Change Number). The system change number (SCN) is Oracle's clock, every time we commit, the clock increments. The SCN marks a consistent point in time in the database which is a checkpoint that is the act of writing dirty blocks (modified blocks from the buffer cache to disk). We can compare it to GTID in MySQL.

Data Guard transport services handle all aspects of transmitting redo from a primary to a standby database. As users commit transactions on the primary, redo records are generated and written to a local online log file. Data Guard transport services simultaneously transmit the same redo directly from the primary database log buffer (memory allocated within system global area) to the standby database(s) where it is written to a standby redo log file.

There are a few main differences between MySQL replication and Data Guard. Data Guard’s direct transmission from memory avoids disk I/O overhead on the primary database. It is different from how MySQL works - reading data from memory decreases I/O on a primary database.

Data Guard transmits only database redo. It is in stark contrast to storage remote-mirroring which must transmit every changed block in every file to maintain real-time synchronization.

Async + Sync Models

Oracle Data Guard offers three different models for the redo apply. Adaptive models dependent on available hardware, processes, and ultimately business needs.

  • Maximum Performance - default mode of operation, allowing a transaction to commit as soon as the redo data needed to recover that transaction is written to the local redo log on the master.
  • Maximum Protection - no data loss and the maximum level of protection. The redo data needed to improve each operation must be written to both the local online redo log on the master and standby redo log on at least one standby database before the transaction commits (Oracle recommends at least two standbys). The primary database will shut down if a fault blocks it from writing its redo stream to at least one synchronized standby database.
  • Maximum Availability - similar to Maximum Protection but the primary database will not shut down if a fault prevents it from writing its redo stream.

When it comes to choosing your MySQL replication setup, you have the choice between Asynchronous replication or Semi-Synchronous replication.

  • Asynchronous binlog apply is the default method for MySQL replication. The master writes events to its binary log and slaves request them when they are ready. There is no guarantee that any event will ever reach any slave.
  • Semi-synchronous commit on primary is delayed until master receives an acknowledgment from the semi-synchronous slave that data is received and written by the slave. Please note that semi-synchronous replication requires an additional plugin to be installed.

Standby Systems Utilization

MySQL is well known for its replication simplicity and flexibility. By default, you can read or even write to your standby/slave servers. Luckily, MySQL 5.6 and 5.7 brought many significant enhancements to Replication, including Global Transaction IDs, event checksums, multi-threaded slaves and crash-safe slaves/masters to make it even better. DBAs accustomed to MySQL replication reads and writes would expect a similar or even simpler solution from it's bigger brother, Oracle. Unfortunately not by default.

The standard physical standby implementation for Oracle is closed for any read-write operations. In fact, Oracle offers logical variation but it has many limitations, and it's not designed for HA. The solution to this problem is an additional paid feature called Active Data Guard, which you can use to read data from the standby while you apply redo logs.

Active Data Guard is a paid add-on solution to Oracle’s free Data Guard disaster recovery software available only for Oracle Database Enterprise Edition (highest cost license). It delivers read-only access, while continuously applying changes sent from the primary database. As an active standby database, it helps offload read queries, reporting and incremental backups from the primary database. The product’s architecture is designed to allow standby databases to be isolated from failures that may occur at the primary database.

An exciting feature of Oracle database 12c and something that Oracle DBA would miss is the data corruption validation. Oracle Data Guard corruption checks are performed to ensure that data is in exact alignment before data is copied to a standby database. This mechanism can also be used to restore data blocks on the primary directly from the standby database.

Failover, Switchover, and Automatic Recovery

To keep your replication setup stable and running, it is crucial for the system to be resilient to failures. Failures are caused by either software bugs, configuration problems or hardware issues, and can happen at any time. In case a server goes down, you need an alarm notification about the degraded setup. Failover (promotion of a slave to master) can be performed by the admin, who needs to decide which slave to promote.

The admin needs information about the failure, the synchronization status in case any data will be lost, and finally, steps to perform the action. Ideally, all should be automated and visible from a single console.

There are two main approaches to MySQL failover, automatic and manual. Both options have its fans, we describe the concepts in another article.

With the GTID, the manual failover becomes much easier. It consists of steps like:

  • Stop the receiver module (STOP SLAVE IO_THREAD)
  • Switch master (CHANGE MASTER TO <new_master_def>)
  • Start the receiver module (START SLAVE IO_THREAD)

Oracle Data Guard comes with a dedicated failover/switchover solution - Data Guard Broker. The broker is a distributed management framework that automates and centralizes the creation, maintenance, and monitoring of Oracle Data Guard configurations. With the access to the DG broker tool, you can perform configuration changes, switchovers, failovers and even dry test of your high availability setup. The two main actions are:

  • The command SWITCHOVER TO < standby database name > is used to perform the switchover operation. After the successful switchover operation, database instances switch places and replication continues. It’s not possible to switchover when standby is not responding or it’s down.
  • The common FAILOVER TO <standby database name> is used to perform the failover. After the failover operation, the previous primary server requires recreation but the new primary can take the database workload.

Speaking about failover, we need to consider how seamless your application failover can be. In the event of a planned/unplanned outage, how efficiently can user sessions be directed to a secondary site, with minimal business interruption.

The standard approach for MySQL would be to use one of the available Load Balancers. Starting from HAProxy which is widely used for HTTP or TCP/IP failover to database aware Maxscale or ProxySQL.

In Oracle, this problem is addressed by TAF (Transparent Application Failover). Once switchover or failover occurs, the application is automatically directed to the new primary. TAF enables the application to automatically and transparently reconnect to a new database, if the database instance to which the connection is made fails.

ClusterControl
Single Console for Your Entire Database Infrastructure
Find out what else is new in ClusterControl

Security

Data security is a hot issue for many organizations these days. For those who need to implement standards like PCI DSS or HIPAA, database security is a must. The cross WAN environments might lead to concerns about data privacy and security especially as more businesses are having to comply with national and international regulations. MySQL binary logs used for replication may contain easy to read sensitive data. With the standard configuration, stealing data is a very easy process. MySQL supports SSL as a mechanism to encrypt traffic both between MySQL servers (replication) and between MySQL servers and clients. A typical way of implementing SSL encryption is to use self-signed certificates. Most of the time, it is not required to obtain an SSL certificate issued by the Certificate Authority. You can either use openssl to create certificates, example below:

$ openssl genrsa 2048 > ca-key.pem
$ openssl req -new -x509 -nodes -days 3600 -key ca-key.pem > ca-cert.pem
$ openssl req -newkey rsa:2048 -days 3600 -nodes -keyout client-key.pem > client-req.pem
$ openssl x509 -req -in client-req.pem -days 1000 -CA ca-cert.pem -CAkey ca-key.pem -set_serial 01 > client-cert.pem
$ openssl req -newkey rsa:2048 -days 3600 -nodes -keyout client-key.pem > client-req.pem
$ openssl x509 -req -in client-req.pem -days 1000 -CA ca-cert.pem -CAkey ca-key.pem -set_serial 01 > client-cert.pem
$ openssl rsa -in client-key.pem -out client-key.pem
$ openssl rsa -in server-key.pem -out server-key.pem

Then modify replication with parameters for SSL.

….MASTER_SSL=1, MASTER_SSL_CA = '/etc/security/ca.pem', MASTER_SSL_CERT = '/etc/security/client-cert.pem', MASTER_SSL_KEY = '/etc/security/client-key.pem';

For more automated option, you can use ClusterControl to enable encryption and manage SSL keys.

In Oracle 12c, Data Guard redo transport can be integrated with a set of dedicated security features called Oracle Advanced Security (OAS). Advanced Security can be used to enable encryption and authentication services between the primary and standby systems. For example, enabling Advanced Encryption Standard (AES) encryption algorithm requires only a few parameter changes in sqlnet.ora file to make redo (similar to MySQL binlog) encrypted. No external certificate setup is required and it only requires a restart of the standby database. The modification in sqlnet.ora and wallet are simple as:

Create a wallet directory

mkdir /u01/app/wallet

Edit sqlnet.ora

ENCRYPTION_WALLET_LOCATION=
 (SOURCE=
  (METHOD=file)
   (METHOD_DATA=
    (DIRECTORY=/u01/app/wallet)))

Create a keystore

ADMINISTER KEY MANAGEMENT CREATE KEYSTORE '/u01/app/wallet' identified by root ;

Open store

ADMINISTER KEY MANAGEMENT set KEYSTORE open identified by root ;

Create a master key

ADMINISTER KEY MANAGEMENT SET KEY IDENTIFIED BY root WITH BACKUP;

On standby

copy p12 and .sso files in the wallet directory and to update the sqlnet.ora file similar to the primary node.

For more information please follow Oracle's TDE white paper, you can learn from the whitepaper how to encrypt datafile and make wallet always open.

Ease of Use and Management

When you manage or deploy Oracle Data Guard configuration, you may find out that there are many steps and parameters to look for. To answer that, Oracle created DG Broker.

You can certainly create a Data Guard configuration without implementing the DG Broker but it can make your life much more comfortable. When it's implemented, the Broker’s command line utility - DGMGRL is probably the primary choice for the DBA. For those who prefer GUI, Cloud Control 13c has an option to access DG Broker via the web interface.

The tasks that Broker can help with are an automatic start of the managed recovery, one command for failover/switchover, monitoring of DG replication, configuration verification and many other.

DGMGRL> show configuration 
Configuration - orcl_s9s_config 

Protection Mode: MaxPerformance
  Members:

s9sp  - Primary database
    s9ss - Physical standby database 

Fast-Start Failover: DISABLED
Configuration Status:
SUCCESS   (status updated 12 seconds ago

MySQL does not offer a similar solution to Oracle DG Broker. However you can extend its functionality by using tools like Orchestrator, MHA and load balancers (ProxySQL, HAProxy or Maxscale). The solution to manage databases and load balancers is ClusterControl. The ClusterControl Enterprise Edition gives you will a full set of management and scaling features in addition to the deployment and monitoring functions offered as part of the free Community Edition.

Severalnines 2018 Momentum: Raising the Bar on MySQL, MariaDB, PostgreSQL & MongoDB Management

$
0
0

I’d like to take advantage of the quiet days between holidays to look back on 2018 at Severalnines as we continue to advance automation and management of the world’s most popular open source databases: MySQL, MariaDB, PostgreSQL & MongoDB!

And take this opportunity to thank you all for your support in the past 12 months and celebrate some of our successes with you …

2018 Severalnines Momentum Highlights:

For those who don’t know about it yet, ClusterControl helps database users deploy, monitor, manage and scale SQL and NoSQL open source databases such as MySQL, MariaDB, PostgreSQL and MongoDB.

Automation and control of open source database infrastructure across mixed environments makes ClusterControl the ideal polyglot solution to support modern businesses - be they large or small.

The reason for ClusterControl’s popularity is the way it provides full operational visibility and control for open source databases.

But don’t take my word for it: we’ve published a year-end video this week that not only summarises our year’s achievements, but also includes customer and user quotes highlighting why they’ve chosen ClusterControl to help them administer their open source database infrastructure.

As a self-funded (mature) startup, our team’s focus is solely on solving pressing customer and community user needs. We do so with our product of course, but just as importantly also through our content contributions to the open source database community. We publish technical content daily that ranges from blogs to white papers, webinars and more.

These Are Our Top Feature & Content Hits in 2018

Top 3 New ClusterControl Features

SCUMM: agent-based monitoring infrastructure & dashboards

SCUMM - Severalnines CMON Unified Monitoring and Management - introduces new agent-based monitoring infrastructure with a server pulling metrics from agents that run on the same hosts as the monitored databases and uses Prometheus agents for greater accuracy and customization options while monitoring your database clusters.

Cloud database deployment

Introduces tighter integration with AWS, Azure and Google Cloud, so it is now possible to launch new instances and deploy MySQL, MariaDB, MongoDB and PostgreSQL directly from the ClusterControl user interface.

Comprehensive automation and management of PostgreSQL

Throughout the year, we’ve introduced a whole range of new features for PostgreSQL: from full backup and restore encryption for pg_dump and pg_basebackup, continuous archiving and Point-in-Time Recovery (PITR) for PostgreSQL, all the way to a new PostgreSQL performance dashboard.

Top 3 Most Read New Blogs

My Favorite PostgreSQL Queries and Why They Matter

Joshua Otwell presents a combination of eight differing queries or types of queries he has found interesting and engaging to explore, study, learn, or otherwise manipulate data sets.

A Performance Cheat Sheet for PostgreSQL

Sebastian Insausti discusses how one goes about analyzing the workload, or queries, that are running, as well as review some basic configuration parameters to improve the performance of PostgreSQL databases.

Deploying PostgreSQL on a Docker Container

Our team explains how to use Docker to run a PostgreSQL database.

Top 3 Most Downloaded White Papers

MySQL on Docker - How to Containerize the Dolphin

Covers the basics you need to understand when considering to run a MySQL service on top of Docker container virtualization. Although Docker can help automate deployment of MySQL, the database still has to be managed and monitored. ClusterControl can provide a complete operational platform for production database workloads.

PostgreSQL Management & Automation with ClusterControl

Discusses some of the challenges that may arise when administering a PostgreSQL database as well as some of the most important tasks an administrator needs to handle; and how to do so effectively … with ClusterControl. See how much time and effort can be saved, as well as risks mitigated, by the usage of such a unified management platform.

How to Design Highly Available Open Source Database Environments

Discusses the requirements for high availability in database setups, and how to design the system from the ground up for continuous data integrity.

Top 3 Most Watched Webinars

Our Guide to MySQL & MariaDB Performance Tuning

Watch as Krzysztof Książek, Senior Support Engineer at Severalnines, walks you through the ins and outs of performance tuning for MySQL and MariaDB, and share his tips & tricks on how to optimally tune your databases for performance.

Designing Open Source Databases for High Availability

From discussing high availability concepts through to failover or switch over mechanisms, this webinar covers all the need-to-know information when it comes to building highly available database infrastructures.

Backup Management for MySQL, MariaDB, PostgreSQL & MongoDB with ClusterControl

Whether you are looking at rebuilding your existing backup infrastructure, or updating it, then this webinar is for you: watch replay of this webinar on Backup Management for MySQL, MariaDB, PostgreSQL and MongoDB with ClusterControl.


Thanks again for your support this year and “see you” in 2019!

Happy New Year from everyone at Severalnines!

PS.: To join Severalnines’ growing customer base please click here

What is MariaDB TX? How to Manage the New MariaDB MySQL Fork!

$
0
0

You may have heard about MariaDB TX and you may have wondered what it is?

Is there a difference between it and MariaDB Server 10.3?

In this blog post we would like to give you an overview of the MariaDB TX and what it is all about.

In short: MariaDB TX is a subscription in which MariaDB combines multiple offerings building a fully-featured transactional database.

The database used in MariaDB TX is MariaDB Server 10.3, which also includes Galera Cluster for synchronous multi-master replication. For the proxy layer MariaDB TX uses MaxScale.

Let’s focus a bit on those two main offerings, going over their features.

MariaDB Server 10.3

MariaDB Server 10.3 is no longer a drop-in replacement for MySQL.

It evolved into a feature-complete fork, which implements new functionalities on top of what Oracle implements in the upstream. MariaDB 10.3 comes with a list of enterprise-focused features.

Oracle Compatibility

MariaDB 10.3 comes with SQL_MODE=ORACLE, which improves compatibility for SQL syntax used in MariaDB 10.3 with Oracle PL/SQL. Following compatibility features are included in the MariaDB TX:

  • Stored Procedure Parameters
  • Non-ANSI Stored Procedure Construct
  • Cursor Syntax
  • Loop Syntax
  • Variable Declaration
  • Data Type inheritance (%TYPE, %ROWTYPE)
  • PL/SQL style Exceptions
  • Synonyms for Basic SQL Types (VARCHAR2, NUMBER, …)

This allows for easier migration of your applications from Oracle databases into MariaDB TX.

Up to 80% of the Oracle PL/SQL code can now be executed on MariaDB without a need for introducing changes; this seriously impacts the overall learning curve and reduces time needed to rewrite the legacy code to run on MariaDB TX.

What’s also important to keep in mind, MariaDB TX comes with a support package and you will get access to consultants who will be able to share migration best practices with you or even straight help you in the planning process to make the transition even less troublesome.

Improvements in SQL

MariaDB TX brings us also improvements in SQL syntax, including new features that should be very useful for developers like Window functions or Common table expressions. Also a temporal subclauses could be very useful as they allow for accessing multiple versions of a given row based on a specific point in time.

All the features are listed below:

  • Temporal subclauses (e.g., AS OF)
  • User-defined aggregate functions
  • Ordered-set aggregate functions
  • INTERSECT/EXCEPT
  • Table value constructors
  • DDL/SELECT lock timeout
  • Common table expressions
  • Window functions
  • JSON functions

External Storage Engines

The default engine for MariaDB is InnoDB, transactional, all-round storage engine.

It is suitable for most of the workloads and it works great for OLTP (Online Transaction Processing) workload. It’s not the only storage engine available in MariaDB TX, though. You get access to Spider engine, which can be used to partition your data across multiple MariaDB instances while maintaining support for XA transactions.

Another storage engine you can use is MyRocks, an engine optimized for storage and write amplification reduction. Battle-tested in Facebook, LSN-based, it suits perfectly for storing large volumes of data on SSD storage, reducing the costs by implementing strong compression and by reducing the number of writes required for a given workload (and thus minimizing the SSD wear out).

Galera Cluster

MariaDB TX gives you easy access to the Galera Cluster, a virtually synchronous, multi-master replication. Galera Cluster can be used to design highly available, WAN-spanning clusters.

Galera Cluster is built on top of the quorum-aware protocol, which ensures that the network partitioning will not be an issue and that the split brain should no longer be a problem. Galera Cluster provides means of auto-provisioning new or failed nodes, reducing the management footprint.

Operational Features

MariaDB TX also provides some features related to the operational tasks. Instant ADD COLUMN helps to reduce impact of one of the most common schema changes. Invisible columns help to maintain compatibility between old and new code. Indexes on virtual columns will boost the performance.

Mariabackup

MariaDB TX implements data-at-rest encryption which includes encryption of binary logs. To ensure that MariaDB TX users can benefit from lock-free backups, Mariabackup had been created. It is an improved fork of Xtrabackup, which did not work correctly with MariaDB TX encryption features. Now, you can enjoy your hot, physical backups with Mariabackup while having your data safely encrypted.

MariaDB MaxScale

In addition to MariaDB 10.3, MariaDB TX comes with MaxScale 2.3, a SQL-aware proxy which can be used to build highly available environments. It comes with numerous features and we would like to go over the most important of them here.

Automatic Failover

MaxScale can be used to track the health of the master MariaDB node and, should it fail, perform a fast, automatic failover. Automated failover is crucial in building up a highly available solution that can recover promptly from the failure.

Read-Write Splitting

Read-write splitting is critical feature to allow read scaling. It is enough for the application to connect to the MaxScale and it will detect the topology, determine which MariaDB acts as master and which act as slaves. It will then route the traffic accordingly to this. SELECT queries will be sent to the slaves, writes will be sent to the master. Everything happens automatically, topology is monitored all the time and should a failover happened, traffic will be re-routed based on the change.

Transparent Query Routing

MaxScale, being the point of entry of the traffic into MariaDB TX, can be used to do a read-write split. Sometimes this is still not enough and it would be great to have a way of controlling where given query should be sent. This is possible in MaxScale - you can match the queries using regular expressions and then decide should they be sent to the master or to slaves. This can help in some particular cases where SELECT query has to be executed on the master due to read-after-write issues or just because it has to have the most up-to-date view of the dataset.

Query Result Caching

To improve performance, query caching is a must. Query cache available in MariaDB will just not work in highly concurrent environment as it enforces serialization of the queries, seriously reducing the performance even for read-only workloads. Using external solution for cache is not always feasible: after all you will end up with yet another database to maintain, secure and keep healthy. It might be better to use MaxScale as a cache assuming that you already use it for other functionality.

Query Blocking

Sometimes databases suffer from an inefficient query, which creates high load on the system. It could be that rewriting that query would take way too long time (someone would have to rewrite it, test the change on staging and then finally deploy to production), a time you don’t have. MaxScale can help you here with features like query blocking, which basically allow you to stop a given query from hitting the database. This feature can also be used to build a SQL firewall - drop all of the queries which match patterns that point towards SQL inject or other, potentially dangerous and malicious, activities.

As you can see, MariaDB TX comes with a list of features and software that’s designed to work together and build highly available, scalable database for transactional data processing.

Enterprise Monitoring & Management for MariaDB TX

ClusterControl supports MariaDB TX fully. You can easily deploy both MariaDB Server 10.3 and MaxScale 2.3. ClusterControl supports MariaDB replication setups as well as MariaDB Galera Cluster.

As long as you have SSH connectivity from your ClusterControl instance to the nodes you want to deploy MariaDB TX on, you can do so in just a couple of clicks.

First you have to define how ClusterControl will reach the MariaDB TX nodes.

Then, pick MariaDB as the vendor and go for one of the supported versions. Pass the MariaDB root password.

Finally, decide upon the topology. You can deploy MariaDB TX in a master - master, active - standby setup with additional slaves. Replication will use MariaDB GTID.

For MariaDB Galera Cluster first step is exactly the same, then you just have to pick the MariaDB as the vendor, decide on the version and define nodes in the MariaDB Galera Cluster:

ClusterControl
Single Console for Your Entire Database Infrastructure
Find out what else is new in ClusterControl

With the clusters deployed you can use the power of ClusterControl to monitor and manage your MariaDB TX clusters.

For example, adding MaxScale load balancers is just a few clicks away:

Once deployed, you can manage your MaxScale using ClusterControl:

You can scale also scale your Galera cluster by adding new Galera nodes or asynchronous replication slaves. You can add slaves or delayed slaves to your replication setups, or perform topology changes by promoting a slave to master, and reslaving the rest of the setup. ClusterControl will monitor the cluster and attempt to recover failed nodes or clusters should an incident happen. For backups, ClusterControl can help you to define a backup schedule using both mysqldump and Mariabackup so you can easily benefit from the encryption features of MariaDB TX.

For the monitoring and trending part, ClusterControl can be used either in an agentless mode:

Or it can be used along with Prometheus and agents to provide even better insight into what is happening in the MariaDB TX cluster.

We hope this introductory blog post helped you to understand what MariaDB TX is and how ClusterControl can help you manage it.

Announcing ClusterControl 1.7.1: Support for PostgreSQL 11 and MongoDB 4.0, Enhanced Monitoring

$
0
0

We are excited to announce the 1.7.1 release of ClusterControl - the only management system you’ll ever need to take control of your open source database infrastructure!

ClusterControl 1.7.1 introduces the next phase of our exciting agent-based monitoring features for MySQL, Galera Cluster, PostgreSQL & ProxySQL, a suite of new features to help users fully automate and manage PostgreSQL (including support for PostgreSQL 11), support for MongoDB 4.0 ... and more!

Release Highlights

Performance Management

  • Enhanced performance dashboards for MySQL, Galera Cluster, PostgreSQL & ProxySQL
  • Enhanced query monitoring for PostgreSQL: view query statistics

Deployment & Backup Management

  • Create a cluster from backup for MySQL & PostgreSQL
  • Verify/restore backup on a standalone PostgreSQL host
  • ClusterControl Backup & Restore

Additional Highlights

  • Support for PostgreSQL 11 and MongoDB 4.0

View the ClusterControl ChangeLog for all the details!

ClusterControl
Single Console for Your Entire Database Infrastructure
Find out what else is new in ClusterControl

View Release Details and Resources

Release Details

Performance Management

Enhanced performance dashboards for MySQL, Galera Cluster, PostgreSQL & ProxySQL

Since October 2018, ClusterControl users have access to a set of monitoring dashboards that have Prometheus as the data source with its flexible query language and multi-dimensional data model, where time series data is identified by metric name and key/value pairs.

The advantage of this new agent-based monitoring infrastructure is that users can enable their database clusters to use Prometheus exporters to collect metrics on their nodes and hosts, thus avoiding excessive SSH activity for monitoring and metrics collections and use SSH connectivity only for management operations.

These Prometheus exporters can now be installed or enabled Prometheus on your nodes and hosts with MySQL, PostgreSQL and MongoDB based clusters. And you have the possibility to customize collector flags for the exporters (Prometheus), which allows you to disable collecting from MySQL's performance schema for example, if you experience load issues on your server.

This allows for greater accuracy and customization options while monitoring your database clusters. ClusterControl takes care of installing and maintaining Prometheus as well as exporters on the monitored hosts.

With this 1.7.1 release, ClusterControl now also comes with the next iteration of the following (new) dashboards:

  • System Overview
  • Cluster Overview
  • MySQL Server - General
  • MySQL Server - Caches
  • MySQL InnoDB Metrics
  • Galera Cluster Overview
  • Galera Server Overview
  • PostgreSQL Overview
  • ProxySQL Overview
  • HAProxy Overview
  • MongoDB Cluster Overview
  • MongoDB ReplicaSet
  • MongoDB Server

Do check them out and let us know what you think!

MongoDB Cluster Overview
HAProxy Overview
HAProxy Overview

Performance Management

Advanced query monitoring for PostgreSQL: view query statistics

ClusterControl 1.7.1 now comes with a whole range of new query statistics that can easily be viewed and monitored via the ClusterControl GUI. The following statistics are included in this new release:

  • Access by sequential or index scans
  • Table I/O statistics
  • Index I/O statistics
  • Database Wide Statistics
  • Table Bloat And Index Bloat
  • Top 10 largest tables
  • Database Sizes
  • Last analyzed or vacuumed
  • Unused indexes
  • Duplicate indexes
  • Exclusive lock waits
Table Bloat & Index Bloat

Deployment

Create a cluster from backup for MySQL & PostgreSQL

To be able to deliver database and application changes more quickly, several tasks must be automated. It can be a daunting job to ensure that a development team has the latest database build for the test when there is a proliferation of copies, and the production database is in use.

ClusterControl provides a single process to create a new cluster from backup with no impact on the source database system.

With this new release, you can easily create MySQL Galera or PostgreSQL including the data from backup you need.

Backup Management

ClusterControl Backup/Restore

ClusterControl users can use this new feature to migrate a setup from one controller to another controller; and backup the meta-data of an entire controller or individual clusters from the s9s CLI. The backup can then be restored on a new controller with a new hostname/IP and the restore process will automatically recreate database access privileges. Check it out!

Additional New Functionalities

View the ClusterControl ChangeLog for all the details!

Download ClusterControl today!

Happy Clustering!

Viewing all 327 articles
Browse latest View live