Quantcast
Channel: Severalnines - MariaDB
Viewing all 327 articles
Browse latest View live

Webinar Replay and Q&A: Load balancing MySQL & MariaDB with ProxySQL & ClusterControl

$
0
0

Thanks to everyone who participated in our recent webinar on how to load balance MySQL and MariaDB with ClusterControl and ProxySQL!

This joint webinar with ProxySQL creator René Cannaò generated a lot of interest … and a lot of questions!

We covered topics such as ProxySQL concepts (with hostgroups, query rules, connection multiplexing and configuration management), went through a live demo of a ProxySQL setup in ClusterControl (try it free) and discussed upcoming ClusterControl features for ProxySQL.

These topics triggered a lot of related questions, to which you can find our answers below.

If you missed the webinar, would like to watch it again or browse through the slides, it is available for viewing online.

Watch the webinar replay

You can also join us for our follow-up webinar next week on Tuesday, April 4th 2017. We’re again joined by René and will be discussing High Availability in ProxySQL.

Sign up for the webinar on HA in ProxySQL

Webinar Questions & Answers

Q. Thank you for your presentation. I have a question about connection multiplexing: does ProxySQL ensure that all statements from start transaction to commit are sent through the same backend connection?

A. This is configurable.

A small preface first: at any time, each client’s session can have one or more backend connections associated with it. A backend connection is associated to a client when a query needs to be executed, and normally it returns immediately back to the connection pool. “Normally” means that there are circumstances when this doesn’t happen. For example, when a transaction starts, the connection is not returned anymore to the connection pool until the transaction completes (either commits or rollbacks). This means that all the queries that should be routed to the same hostgroup where the transaction is running, are guaranteed to run in the same connection.

Nonetheless, by default, a transaction doesn’t disable query routing. That means that while a transaction is running on one connection to a specific hostgroup and this connection is associated with only that client, if the client sends a query destinated to another hostgroup, that query could be sent to a different connection.

Whatever the query could be sent to a different connection or not based on query rules is configurable by the value of mysql_users.transaction_persistent:

  • 0 = queries for different hostgroup can be routed to different connections while a transaction is running;
  • 1 = query routing will be disabled while the transaction is running.

The behaviour is configurable because it depends on the application. Some applications require that all the queries are part of the same transaction, other applications don’t.

Q. What is the best way to set up a ProxySQL cluster? The main concern here is configuration of the ProxySQL cascading throughout the cluster.

A. ProxySQL can be deployed in numerous ways.

One typical deployment pattern is to deploy a ProxySQL instance on every application host. The application would then connect to the proxy using very low latency connection via Unix socket. If the number of application hosts increase, you can deploy a middle-layer of 3-5 ProxySQL instances and configure all ProxySQL instances from application servers to connect via this middle-layer. Configuration management, typically, would be handled using Puppet/Chef/Ansible infrastructure orchestration tools. You can also easily use home-grown scripts as ProxySQL’s admin interface is accessible via MySQL command line and ProxySQL reconfiguration can be done by issuing a couple of SQL statements.

Q. How would you recommend to make the ProxySQL layer itself highly available?

There are numerous methods to achieve this.

One common method is to deploy a ProxySQL instance on every application host. The application would then connect to the proxy using very low latency connection via Unix socket. In such a deployment there is no single point of failure as every application host connects to the ProxySQL installed locally.

When you implement a middle-layer, you will also maintain HA as 3-5 ProxySQL nodes would be enough to make sure that at least some of them are available for local proxies from application hosts.

Another common method of deploying a highly available ProxySQL setup is to use tools like keepalived along with virtual IP. The application will connect to VIP and this IP will be moved from one ProxySQL instance to another if keepalived detects that something happened to the “main” ProxySQL.

Q. How can ProxySQL use the right hostgroup for each query?

A. ProxySQL route queries to hostgroups is based on query rules - it is up to the user to build a set of rules which make sense in their environment.

Q. Can you tell us more about query mirroring?

A. In general, the implementation of query mirroring in ProxySQL allows you to send traffic to two hostgroups.

Traffic sent to the “main” hostgroup is ensured to reach it (unless there are no hosts in that hostgroup); on the other hand, mirror hostgroup will receive traffic on a “best effort” basis - it should but it is not guaranteed that the query will indeed reach the mirrored hostgroup.

This limits the usefulness of mirroring as a method to replicate data. It is still an amazing way to do load testing of new hardware or redesigned schema. Of course, mirroring reduces the maximal throughput of the proxy - queries have to be executed twice so the load is also twice as high. The load is not split between the two, but duplicated.

Q. And what about query caching?

Query cache in ProxySQL is implemented as a simple key->value memory store with Time To Live for every entry. What will be cached and for how long - this is decided on the query rules level. The user can define a query rule matching a particular query or a wider spectrum of them. To identify query results set in cache, ProxySQL uses query hash along with information about user and schema.

How to set TTL for a query? The simplest answer is: to the maximum value of replication lag which is acceptable for this query. If you are ok to read stale data from slave, which is lagging 10 seconds, you should be fine reading stale data from cache when TTL is set to 10000 milliseconds.

Q. Connection limit to backends?

A. ProxySQL indeed implements a connection limit to backend servers. The maximum number of connections to any backend instance is defined in mysql_servers table.

Because the same backend server can be present in multiple hostgroups, it is possible to define the maximum number of connections per server per hostgroup.

This is useful for example in the case of a small set of connections where specific long running queries are queued without affecting the rest of the traffic destinated to the same server.

Q. Regarding the connection limit from the APP: are connections QUEUED?

A. If you reach the mysql-max_connections, further connections will be rejected with the error “Too many connections”.

It is important to remember that there is not a one-to-one mapping between application connections and backend connections.

That means that:

  • Access to the backends can be queued, but connections from the application are either accepted or rejected.
  • A large number of application connections can use a small number of backend connections.

Q. I haven’t heard of SHUN before: what does it mean?

A. SHUN means that the backend is temporarily marked as non-available but ProxySQL will attempt to connect to it after mysql-shun_recovery_time_sec seconds

Q. Is query sharding available across slaves?

A. Depending on the meaning of sharding, ProxySQL can be used to perform sharding across slaves. For example, it is possible to send all traffic for a specific set of tables to a set of slaves (in a hostgroup). Splitting the slaves into multiple hostgroups and performing query sharding accordingly is possible to improve performance, as each slave won’t read from disk data from tables for which it doesn’t process any query.

Q. How do you sync the configuration of ProxySQL when you have many instances for H.A ?

A. Configuration management, typically, would be handled using Puppet/Chef/Ansible infrastructure orchestration tools. You can also easily use home-grown scripts as ProxySQL’s admin interface is accessible via MySQL command line and ProxySQL reconfiguration can be done by issuing a couple of SQL statements.

Q. How flexible or feasible it is to change the ProxySQL config online, eg. if one database slave is down, how is that handled in such a scenario ?

A. ProxySQL configuration can be changed at any time; it’s been designed with such level of flexibility in mind.

‘Database down’ can be handled differently, it depends on how ProxySQL is configured. If you happen to rely on replication hostgroups to define writer and reader hostgroups (this is how ClusterControl deploys ProxySQL), ProxySQL will monitor state of read_only variable on both reader and writer hostgroups and it will move hosts as needed.

If master is promoted by external tools (like ClusterControl, for example), read_only values will change and ProxySQL will detect a topology change and it will act accordingly. For a standard “slave down” scenario there is no required action from the management system standpoint - without any changes in read_only value ProxySQL will just detect that the host is not available and it will stop sending queries to it, re-executing on other members of the hostgroup those queries which didn’t complete on dead slave.

If we are talking about a setup not using replication hostgroups then it is up to the user and their scripts/tools to implement some sort of logic and reconfigure ProxySQL on runtime using admin interface. Slave down, though, most likely wouldn’t require any changes.

Q. Is it somehow possible to SELECT data from one host group into another host group?

A. No, at this point it is not possible to execute cross-hostgroup queries.

Q. What would be RAM/Disk requirements for logs , etc?

A. It basically depends on the amount of log entries and how ProxySQL log is verbose in your environment. Typically it’s neglectable.

Q. Instead of installing ProxySQL on all application servers, could you put a ProxySQL cluster behind a standard load balancer?

A. We see no reason why not? You can put whatever you like in front of the ProxySQL - F5, another layer of software proxies - it is up to you. Please keep in mind, though, that every layer of proxies or load balancers adds latency to your network and, as a result, to your queries.

Q. Can you please comment on Reverse Proxy, whether it can be used in SQL or not?

A. ProxySQL is a Reverse Proxy. Contrary to a Forward Proxy (that acts as an intermediary that simply forwards requests), a Reverse Proxy processes clients’ requests and retrieves data from servers. ProxySQL is a Reverse Proxy: clients send requests to ProxySQL, that will understand the request, analyze it, and decide what to do: rewrite, cache, block, re-execute on failure, etc.

Q. Does the user authentication layer work with non-local database accounts, e.g. with the pam modules available for proxying LDAP users to local users?

A. There is no direct support for LDAP integration but, as configuration management in ProxySQL is a child’s play, it is really simple to put together a script which will pull the user details from LDAP and load them into ProxySQL. You can use cron to sync it often. All ProxySQL needs is a username and password hash in MySQL format - this is enough to add a user to ProxySQL.

Q. It seems like the prescribed production deployment includes many proxies - are there any suggestions or upcoming work to address how to make configuration changes across all proxies in a consistent manner?

A. At this point it is recommended to leverage configuration management tools like Chef/Ansible/Puppet to manage ProxySQL’s configuration.

Watch the webinar replay

You can also join us for our follow-up webinar next week on Tuesday, April 4th 2017. We’re again joined by René and will be discussing High Availability in ProxySQL.

Sign up for the webinar on HA in ProxySQL


Meet the Severalnines team at M|17 and Percona Live this month

$
0
0

This month we’re excited to be participating in two open source database conferences, namely the MariaDB User Conference in New York, M|17, and the Percona Live Conference (formerly known as the MySQL User Conference) in Santa Clara.

And we’re looking forward to presenting, exhibiting and mingling there with fellow open source database enthusiasts.

We’ll have talks at both conferences, and a booth at Percona Live, so do come visit us at booth 411 in the Percona Live Exhibition Hall. We’ll be there to answer any questions you may have on open source database management and automation. And we’re planning to make it a fun place to hang out.

Of course, we look forward to catching up with you as well in New York, if you’re attending the MariaDB conference. See below who our speakers are at both conferences.

These are our talks and speakers at M|17 and Percona Live this month:

Talk @ M|17

Step-By-Step: Clustering with Galera and Docker Swarm

Wednesday, April 12 - 2:10 pm - 3:00 pm

Ashraf Sharif, Senior Support Engineer

Clustering is an important feature in container technology, as multiple nodes are required to provide redundancy and failover in case of outage. Docker Swarm is an orchestration tool that allows administrators to manage a cluster of Docker nodes as one single virtual system. MariaDB Cluster, however, has its own clustering model based on Galera.

In this talk, we’ll look at how to deploy MariaDB Cluster on Docker Swarm with a multi-host environment, by “homogeneousing” the MariaDB image to achieve high availability and scalability in a fully automated way. We will touch upon service controls, multi-host networking, persistent storage, scaling, fault tolerance, service discovery, and load distribution.

Talks @ Percona Live

Become a MongoDB DBA: monitoring essentials

Tuesday, April 25 - 11:30 AM - 12:20 PM @ Ballroom G

Art van Scheppingen, Senior Support Engineer

To operate MongoDB efficiently, you need to have insight into database performance. And with that in mind, we’ll dive into monitoring in this talk. MongoDB offers many metrics through various status overviews and commands, but which ones really matter to you? How do you trend and alert on them? What is the meaning behind the metrics?

We’ll discuss the most important ones and describe them in ordinary plain MySQL DBA language. Finally we’ll have a look at the (open source) tools available for MongoDB monitoring and trending and compare them.

MySQL Load Balancers - MaxScale, ProxySQL, HAProxy, MySQL Router & nginx - a close up look

26 April - 11:10 AM - 12:00 PM @ Ballroom D

Krzysztof Książek, Senior Support Engineer

Load balancing MySQL connections and queries using HAProxy has been popular in the past years. Recently however, we have seen the arrival of MaxScale, MySQL Router, ProxySQL and now also Nginx as a reverse proxy. For which use cases do you use them and how well do they integrate in your environment?

This session aims to give a solid grounding in load balancer technologies for MySQL and MariaDB.

We will review the wide variety of open-source options available: from application connectors (php-mysqlnd, jdbc), TCP reverse proxies (HAproxy, Keepalived, Nginx) and SQL-aware load balancers (MaxScale, ProxySQL, MySQL Router), and look at what considerations you should make when assessing their suitability for your environment.

MySQL (NDB) Cluster Best Practices (Die Hard VIII)

26 April - 3:30 PM - 4:20 PM @ Room 210

Johan Andersson, CTO

MySQL Cluster is a write-scalable, real-time, ACID-compliant transactional database, designed to deliver 99.999% availability. It provides shared-nothing clustering and auto-sharding for MySQL, accessed via SQL and NoSQL interfaces. It is designed to provide high availability and high throughput with low latency, while allowing for near linear scalability. MySQL Cluster is implemented through the NDB or NDBCLUSTER storage engine for MySQL.

In this session we will talk about:

  • Core architecture and Design principles of NDB Cluster
  • APIs for data access (SQL and NoSQL interfaces)
  • Important configuration parameters
  • Best practices: indexing and schema

We will also compare performance between MySQL Cluster 7.5 and Galera (MySQL 5.6/5.7), and how to best make use of the feature set of MySQL Cluster 7.5.

So … Happy clustering, and see you in New York, Santa Clara, or maybe both!

Updated - How to Bootstrap MySQL or MariaDB Galera Cluster

$
0
0

Unlike standard MySQL server and MySQL Cluster, the way to start a MySQL/MariaDB Galera Cluster is a bit different. Galera requires you to start a node in a cluster as a reference point, before the remaining nodes are able to join and form the cluster. This process is known as cluster bootstrap. Bootstrapping is an initial step to introduce a database node as primary component, before others see it as a reference point to sync up data.

How does it work?

When Galera starts with the bootstrap command on a node, that particular node will reach Primary state (check the value of wsrep_cluster_status). The remaining nodes will just require a normal start command and they will automatically look for existing Primary Component (PC) in the cluster and join to form a cluster. Data synchronization then happens through either incremental state transfer (IST) or snapshot state transfer (SST) between the joiner and the donor.

So basically, you should only bootstrap the cluster if you want to start a new cluster or when no other nodes in the cluster is in PRIMARY state. Care should be taken when choosing the action to take, or else you might end up with split clusters or loss of data.

The following example scenarios illustrate when to bootstrap the a three-node cluster based on node state (wsrep_local_state_comment) and cluster state (wsrep_cluster_status):

Galera StateBootstrap Flow
  1. Restart the INITIALIZED node.
  1. Restart the INITIALIZED node.
  2. Once done, start the new node.
  1. Bootstrap the most advanced node using “pc.bootstrap=1”.
  2. Restart the remaining nodes, one node at a time.
  1. Start the new node.
  1. Start the new node, one node at a time.
  1. Bootstrap any node.
  2. Start the remaining nodes, one node at a time.

How to start Galera cluster?

The 3 Galera vendors use different bootstrapping commands (based on the software’s latest version). On the first node, run:

  • MySQL Galera Cluster (Codership):

    $ service mysql bootstrap # sysvinit
    $ galera_new_cluster # systemd
    $ mysqld_safe --wsrep-new-cluster # command line
  • Percona XtraDB Cluster (Percona):

    $ service mysql bootstrap-pxc # sysvinit
    $ systemctl start mysql@bootstrap.service # systemd
  • MariaDB Galera Cluster (MariaDB):

    $ service mysql bootstrap # sysvinit
    $ service mysql start --wsrep-new-cluster # sysvinit
    $ galera_new_cluster # systemd
    $ mysqld_safe --wsrep-new-cluster # command line

The above command is just a wrapper and what it actually does is to start the MySQL instance on that node with gcomm:// as the wsrep_cluster_address variable. You can also manually define the variables inside my.cnf and run the standard start/restart command. However, do not forget to change wsrep_cluster_address back again to contain the addresses to all nodes after the start.

When the first node is live, run the following command on the subsequent nodes:

$ service mysql start
$ systemctl start mysql

The new node connects to the cluster members as defined by the wsrep_cluster_address parameter. It will now automatically retrieve the cluster map and connect to the rest of the nodes and form a cluster.

Warning: Never bootstrap when you want to reconnect a node to an existing cluster, and NEVER run bootstrap on more than one node.

Safe-to-Bootstrap Flag

Galera starting with version 3.19 comes with a new flag called “safe_to_bootstrap” inside grastate.dat. This flag facilitates the decision and prevent unsafe choices by keeping track of the order in which nodes are being shut down. The node that was shut down last will be marked as “Safe-to-Bootstrap”. All the other nodes will be marked as unsafe to bootstrap from.

Looking at grastate.dat (default is under MySQL datadir) content and you should notice the flag on the last line:

# GALERA saved state
version: 2.1
uuid:    8bcf4a34-aedb-14e5-bcc3-d3e36277729f
seqno:   2575
safe_to_bootstrap: 0

When bootstrapping the new cluster, Galera will refuse to start the first node that was marked as unsafe to bootstrap from. You will see the following message in the logs:

“It may not be safe to bootstrap the cluster from this node. It was not the last one to leave the cluster and may not contain all the updates.

To force cluster bootstrap with this node, edit the grastate.dat file manually and set safe_to_bootstrap to 1 .”

In case of unclean shutdown or hard crash, all nodes will have “safe_to_bootstrap: 0”, so we have to consult the InnoDB storage engine to determine which node has committed the last transaction in the cluster. This can be achieved by starting mysqld with the “--wsrep-recover” variable on each of the nodes, which produces an output like this:

$ mysqld --wsrep-recover
...
2016-11-18 01:42:15 36311 [Note] InnoDB: Database was not shutdown normally!
2016-11-18 01:42:15 36311 [Note] InnoDB: Starting crash recovery.
...
2016-11-18 01:42:16 36311 [Note] WSREP: Recovered position: 8bcf4a34-aedb-14e5-bcc3-d3e36277729f:114428
...

The number after the UUID string on the "Recovered position" line is the one to look for. Pick the node that has the highest number and edit its grastate.dat to set “safe_to_bootstrap: 1”, as shown in the example below:

# GALERA saved state
version: 2.1
uuid:    8bcf4a34-aedb-14e5-bcc3-d3e36277729f
seqno:   -1
safe_to_bootstrap: 1

You can then perform the standard bootstrap command on the chosen node.

What if the nodes have diverged?

In certain circumstances, nodes can have diverged from each other. The state of all nodes might turn into Non-Primary due to network split between nodes, cluster crash, or if Galera hit an exception when determining the Primary Component. You will then need to select a node and promote it to be a Primary Component.

To determine which node needs to be bootstrapped, compare the wsrep_last_committed value on all DB nodes:

node1> SHOW STATUS LIKE 'wsrep_%';
+----------------------+-------------+
| Variable_name        | Value       |
+----------------------+-------------+
| wsrep_last_committed | 10032       |
...
| wsrep_cluster_status | non-Primary |
+----------------------+-------------+
node2> SHOW STATUS LIKE 'wsrep_%';
+----------------------+-------------+
| Variable_name        | Value       |
+----------------------+-------------+
| wsrep_last_committed | 10348       |
...
| wsrep_cluster_status | non-Primary |
+----------------------+-------------+
node3> SHOW STATUS LIKE 'wsrep_%';
+----------------------+-------------+
| Variable_name        | Value       |
+----------------------+-------------+
| wsrep_last_committed |   997       |
...
| wsrep_cluster_status | non-Primary |
+----------------------+-------------+

From above outputs, node2 has the most up-to-date data. In this case, all Galera nodes are already started, so you don’t necessarily need to bootstrap the cluster again. We just need to promote node2 to be a Primary Component:

node2> SET GLOBAL wsrep_provider_options="pc.bootstrap=1";

The remaining nodes will then reconnect to the Primary Component (node2) and resync their data based on this node.

ClusterControl
Single Console for Your Entire Database Infrastructure
Find out what else is new in ClusterControl

If you are using ClusterControl (try it for free), you can determine the wsrep_last_committed and wsrep_cluster_status directly from the ClusterControl > Overview page:

Or from ClusterControl > Performance > DB Status page:

Updated - Full Restore of a MySQL or MariaDB Galera Cluster from Backup

$
0
0

Performing regular backups of your database cluster is imperative for high availability and disaster recovery. If for any reason you lost your entire cluster and had to do a full restore from backup, you would need a reliable and up-to-date backup to start from.

Best Practices for Backups

Some recommendations to consider for a good scheduled backup regime:

  • You should be able to completely recover from a catastrophic failure from at least two previous full backups. Just in case the most recent full backup is damaged, lost, or corrupt,
  • Your backup should contain at least one full backup within a chosen cycle, normally weekly,
  • Store backups away from the current data location, preferably off site,
  • Use a mixture of mysqldump and Xtrabackup for extra safety, and not rely on one method,
  • Test restore your backups on a regular basis, e.g. every two months.

A weekly full backup combined with daily incremental backup is normally enough. Keeping a number of backups for a period of time is always a good plan, maybe keep each weekly backup for one month. This allows you to recover an older database in case of emergencies or if for some reason you have local backup file corruption.

mysqldump or Xtrabackup

mysqldump is very likely the most popular way of backing up MySQL. It does a logical backup of the data, reading from each table using SQL statements then exporting the data into text files. Restoration of a mysqldump is as easy as creating the dump file. The main drawbacks are that it is very slow for large databases, it is not ‘hot’ and it wipes out the InnoDB buffer pool.

Xtrabackup performs hot backups, does not lock the database during the backup and is generally faster. Hot backups are important for high availability, as they run without blocking the application. This is also an important factor when used with Galera, as Galera relies on synchronous replication. However, restoring an xtrabackup can be a little tricky using manual ways.

ClusterControl supports the scheduling of both mysqldump and Xtrabackup (full and incremental), as well as the backup restoration right from the UI.

Full Restore from Backup

In this post, we will show you how to restore Xtrabackup (full + incremental) onto an empty cluster running on MariaDB Galera Cluster. These steps should also work on Percona XtraDB Cluster or Galera Cluster for MySQL from Codership.

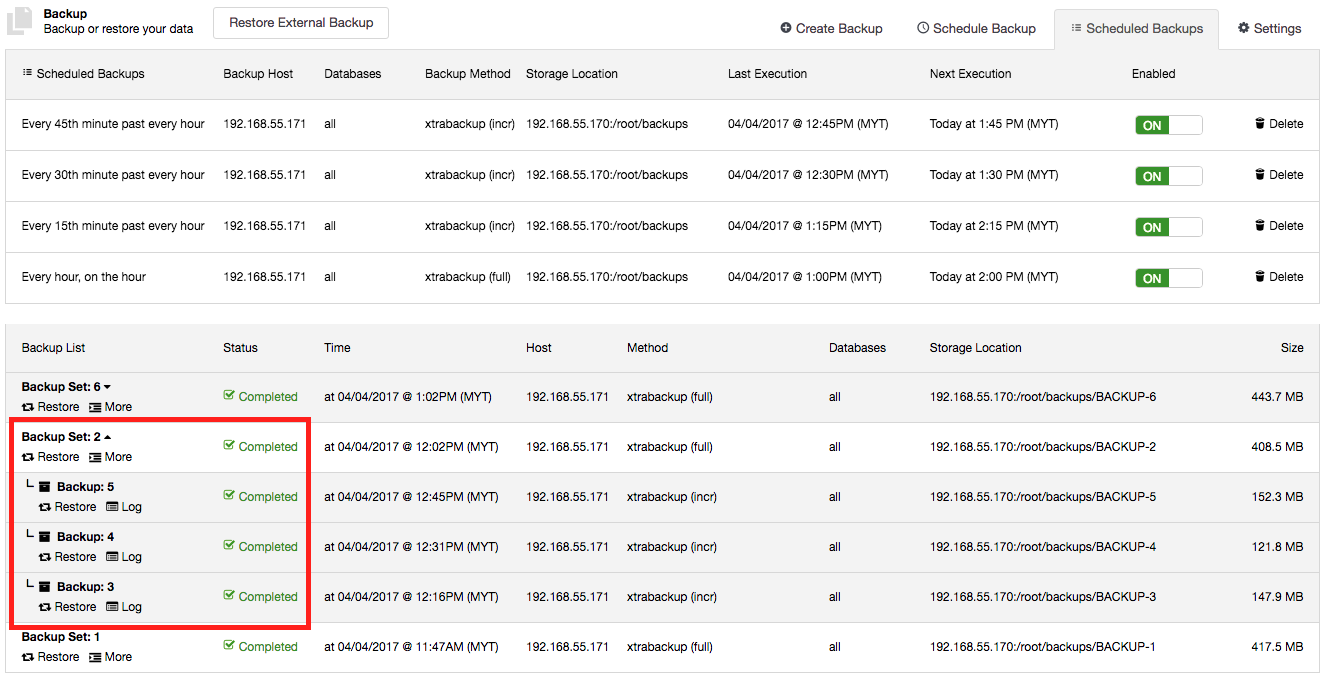
In our original cluster, we had a full xtrabackup scheduled daily, with incremental backups created every hour. The backups are stored on ClusterControl as shown in the following screenshot:

Now, let’s assume we have lost our original cluster and have to do a full restore onto a new cluster. The steps include:

  1. Set up a new ClusterControl server.
  2. Set up a new MariaDB Cluster.
  3. Export the backup records and files to the new ClusterControl server.
  4. Start the restoration process.
  5. Start the remaining nodes.

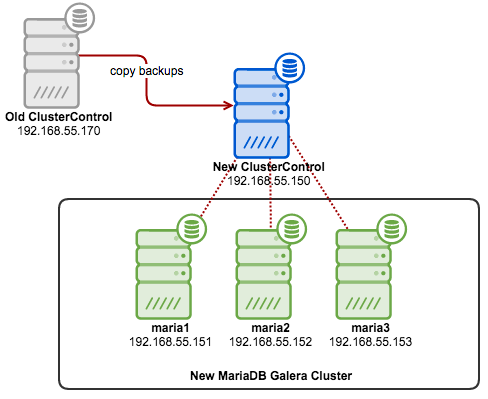
The following diagram illustrates our architecture for this exercise:

Step 1 - Set up New MariaDB Cluster

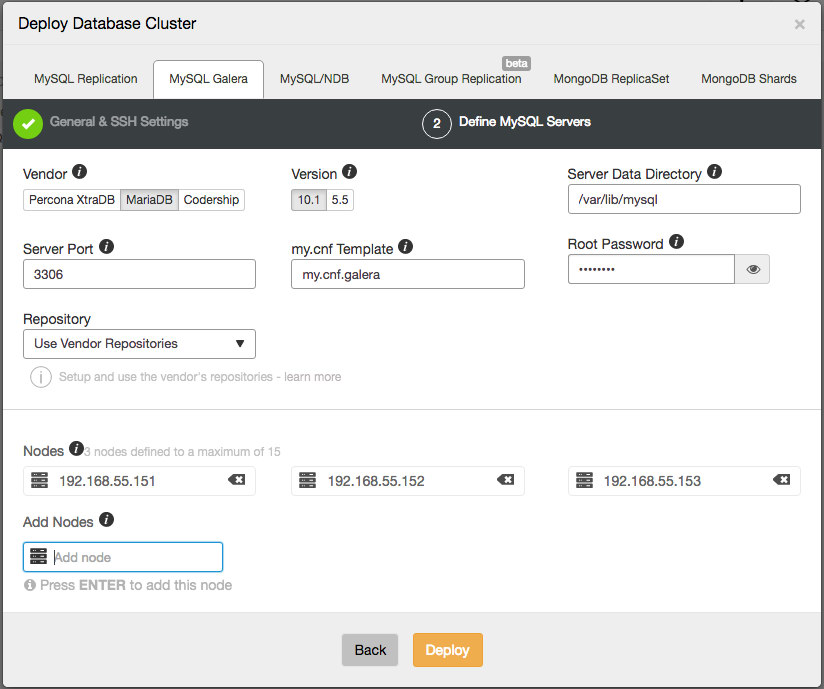
Install ClusterControl and deploy a new MariaDB Cluster. Go to ClusterControl -> Deploy -> Deploy Database Cluster -> MySQL Galera and specify the required information in the deployment dialog:

Click on the Deploy button and start the deployment. Since we only have a cluster on the old server so the cluster ID should be identical (cluster ID: 1) in this new instance.

ClusterControl
Single Console for Your Entire Database Infrastructure
Find out what else is new in ClusterControl

Step 2 - Export and import the backup files

Once the cluster is deployed, we will have to import the backups from the old ClusterControl server into the new one. First, export the content of cmon.backup_records to dump files. Since the old cluster ID and the new one is identical, we just need to modify the dump file with the new IP address and import it to the new ClusterControl node. If the cluster ID is different, then you have to change “cid” value accordingly inside the dump files before importing into CMON DB on the new node. Also, it is easier to keep the backup storage location as in the old server so the new ClusterControl can locate the backup files in the new server.

On the old ClusterControl server, export the backup_records table into dump files:

$ mysqldump -uroot -p --single-transaction --no-create-info cmon backup_records > backup_records.sql

Then, perform remote copy of the backup files from the old server into the new ClusterControl server:

$ scp -r /root/backups 192.168.55.150:/root/
$ scp ~/backup_records.sql 192.168.55.150:~

Next is to modify the dump files to reflect the new ClusterControl server IP address. Don’t forget to escape the dot in the IP address:

$ sed -i "s/192\.168\.55\.170/192\.168\.55\.150/g" backup_records.sql

On the new ClusterControl server, import the dump files:

$ mysql -uroot -p cmon < backup_records.sql

Verify that the backup list is correct in the new ClusterControl server:

As you can see, all occurences of the previous IP address (192.168.55.170) have been replaced by the new IP address (192.168.55.150). Now we are ready to perform the restoration in the new server.

Step 3 - Perform the Restoration

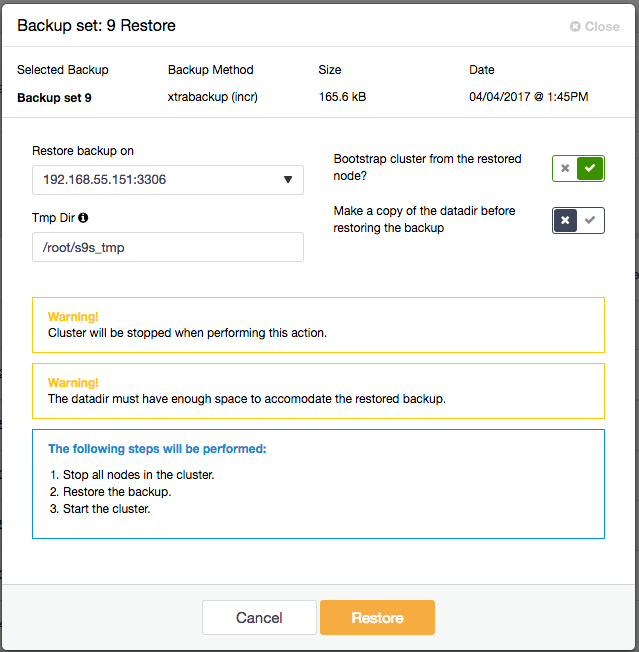
Performing restoration through the ClusterControl UI is a simple point-and-click step. Choose which backup to restore and click on the “Restore” button. We are going to restore the latest incremental backup available (Backup: 9). Click on the “Restore” button just below the backup name and you will be presented with the following pre-restoration dialog:

Looks like the backup size is pretty small (165.6 kB). It doesn’t really matter because ClusterControl will prepare all incremental backups grouped under Backup Set 6, which holds the full Xtrabackup. You also have several post-restoration options:

  • Restore backup on - Choose the node to restore the backup on.
  • Tmp Dir - Directory will be used on the local ClusterControl server as temporary storage during backup preparation. It must be as big as the estimated MySQL data directory.
  • Bootstrap cluster from the restored node - Since this is a new cluster, we are going to toggle this ON so ClusterControl will bootstrap the cluster automatically after the restoration succeeds.
  • Make a copy of the datadir before restoring the backup - If the restored data is corrupted or not as what you are expected it to be, you will have a backup of the previous MySQL data directory. Since this is a new cluster, we are going to ignore this one.

Percona Xtrabackup restoration will cause the cluster to be stopped. ClusterControl will:

  1. Stop all nodes in the cluster.
  2. Restore the backup on the selected node.
  3. Bootstrap the selected node.

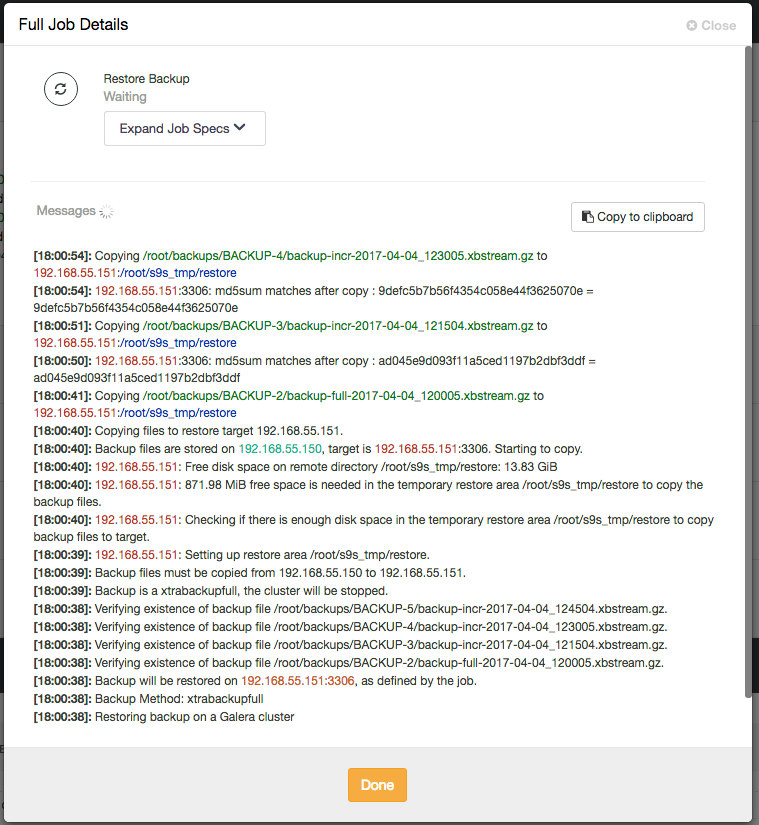
To see the restoration progress, go to Activity -> Jobs -> Restore Backup and click on the “Full Job Details” button. You should see something like this:

One important thing that you need to do is to monitor the output of the MySQL error log on the target node (192.168.55.151) during the restoration process. After the restoration completes and during the bootstrapping process, you should see the following lines starting to appear:

Version: '10.1.22-MariaDB' socket: '/var/lib/mysql/mysql.sock' port: 3306 MariaDB Server
2017-04-07 18:03:51 140608191986432 [Warning] Access denied for user 'cmon'@'192.168.55.150' (using password: YES)
2017-04-07 18:03:52 140608191986432 [Warning] Access denied for user 'cmon'@'192.168.55.150' (using password: YES)
2017-04-07 18:03:53 140608191986432 [Warning] Access denied for user 'cmon'@'192.168.55.150' (using password: YES)
2017-04-07 18:03:54 140608191986432 [Warning] Access denied for user 'cmon'@'192.168.55.150' (using password: YES)
2017-04-07 18:03:55 140608191986432 [Warning] Access denied for user 'cmon'@'192.168.55.150' (using password: YES)

Don’t panic. This is an expected behaviour because this backup set doesn’t store the cmon login credentials of the new ClusterControl cmon password. It has restored/replaced the old cmon user instead. What you need to do is to re-grant cmon user back to the server by running the following statement on this DB node:

GRANT ALL PRIVILEGES ON *.* to cmon@'192.168.55.150' IDENTIFIED BY 'mynewCMONpassw0rd' WITH GRANT OPTION;
FLUSH PRIVILEGES;

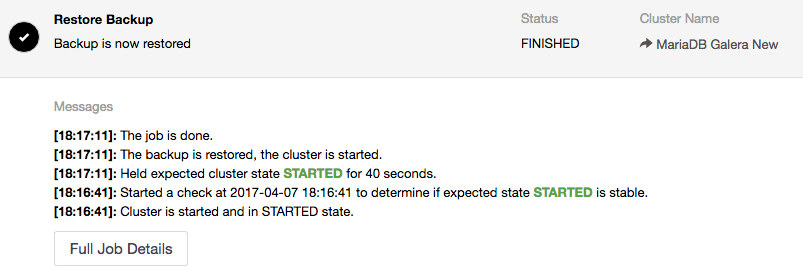
ClusterControl then would be able to connect to the bootstrapped node and determine the node and backup state. If everything is OK, you should see something like this:

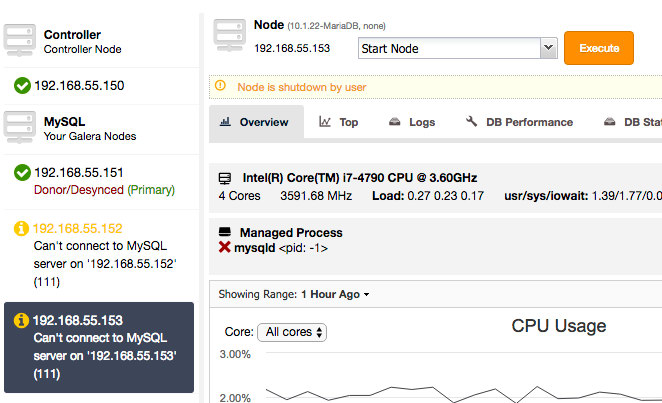
At this point, the target node is bootstrapped and running. We can start the remaining nodes under Nodes -> choose node -> Start Node and check the “Perform an Initial Start” checkbox:

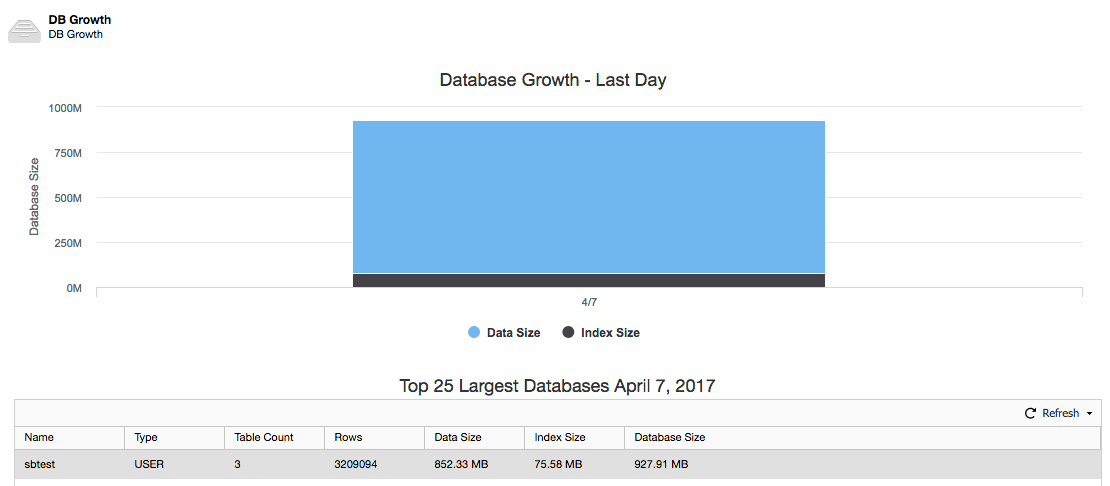
The restoration is now complete and you can expect Performance -> DB Growth to report the updated size of our newly restored data set :

Happy restoring!

How to Deploy Asynchronous Replication Slave to MariaDB Galera Cluster 10.x using ClusterControl

$
0
0

Combining Galera and asynchronous replication in the same MariaDB setup, aka Hybrid Replication, can be useful - e.g. as a live backup node in a remote datacenter or reporting/analytics server. We already blogged about this setup for Codership/Galera or Percona XtraDB Cluster users, but a master failover as described in that post does not work for MariaDB because of its different GTID approach. In this post, we will show you how to deploy an asynchronous replication slave to MariaDB Galera Cluster 10.x (with master failover!), using GTID with ClusterControl.

Preparing the Master

First and foremost, you must ensure that the master and slave nodes are running on MariaDB Galera 10.0.2 or later. A MariaDB replication slave requires at least one master with GTID among the Galera nodes. However, we would recommend users to configure all the MariaDB Galera nodes as masters. GTID, which is automatically enabled in MariaDB, will be used to do master failover.The following must be true for the masters:

  • At least one master among the Galera nodes
  • All masters must be configured with the same domain ID
  • log_slave_updates must be enabled
  • All masters’ MariaDB port is accessible by ClusterControl and slaves
  • Must be running MariaDB version 10.0.2 or later

From ClusterControl this is easily done by selecting Enable Binary Logging in the drop down for each node.

Enabling binary logging through ClusterControl

And then enable GTID in the dialogue:

Once Proceed has been clicked, a job will automatically configure the Galera node according to the settings described earlier.

If you wish to perform this action by hand, you can configure a Galera node as master, by changing the MariaDB configuration file for that node as per below:

gtid_domain_id=<must be same across all mariadb servers participating in replication>
server_id=<must be unique>
binlog_format=ROW
log_slave_updates=1
log_bin=binlog

After making these changes, restart the nodes one by one or using a rolling restart (ClusterControl > Manage > Upgrades > Rolling Restart)

ClusterControl
Single Console for Your Entire Database Infrastructure
Find out what else is new in ClusterControl

Preparing the Slave

For the slave, you would need a separate host or VM with or without MariaDB installed. If you do not have MariaDB installed, you need to perform the following tasks; configure root password (based on monitored_mysql_root_password), create slave user (based on repl_user, repl_password), configure MariaDB, start the server and finally start replication.

Adding the slave using ClusterControl, all these steps will be automated in the Add Replication Slave job as described below.

Add replication slave to MariaDB Cluster

After adding our slave node, our deployment will look like this:

MariaDB Galera asynchronous slave topology

Master Failover and Recovery

Since we are using MariaDB with GTID enabled, master failover is supported via ClusterControl when Cluster and Node Auto Recovery has been enabled. Whether the master would fail due to network connectivity or any other reason, ClusterControl will automatically fail over to the most suitable other master node in the cluster.

Automatic slave failover to another master in Galera cluster

This way ClusterControl will add a robust asynchronous slave capability to your MariaDB Cluster!

ClusterControl for Galera Cluster for MySQL

$
0
0

ClusterControl allows you to easily manage your database infrastructure on premise or in the cloud. With in-depth support for technologies like Galera Cluster for MySQL and MariaDB setups, you can truly automate mixed environments for next-level applications.

Since the launch of ClusterControl in 2012, we’ve experienced growth in new industries with customers who are benefiting from the advancements ClusterControl has to offer - in particular when it comes to Galera Cluster for MySQL.

In addition to reaching new highs in ClusterControl demand, this past year we’ve doubled the size of our team allowing us to continue to provide even more improvements to ClusterControl.

Take a look at this infographic for our top Galera Cluster for MySQL resources and information about how ClusterControl works with Galera Cluster.

Webinar Replay and Q&A: High Availability in ProxySQL for HA MySQL infrastructures

$
0
0

Thanks to everyone who participated in our recent webinar on High Availability in ProxySQL and on how to build a solid, scalable and manageable proxy layer using ProxySQL for highly available MySQL infrastructures.

This second joint webinar with ProxySQL creator René Cannaò saw lots of interest and some nice questions from our audience, which we’re sharing below with this blog post as well as the answers to them.

Building a highly available proxy layer creates additional challenges, such as how to manage multiple proxy instances, how to ensure that their configuration is in sync, Virtual IP and fail-over; and more, which we’ve covered in this webinar with René. And we demonstrated how you can make your ProxySQL highly available when deploying it from ClusterControl (download & try it free).

If you missed the webinar, would like to watch it again or browse through the slides, it is available for viewing online.

Watch the webinar replay

Webinar Questions & Answers

Q.: In a MySQL master/slave pair, I am inclined to deploy ProxySQL instances directly on both master and slave hosts. In an environment of 100s of master/slave pairs, with new hosts being built all the time, I can see this as a good way to combine host / MySQL / ProxySQL master/slave pair deploys via a single Ansible playbook. Do you guys have any thoughts on this?

A.: Our only concern here is that co-locating ProxySQL with database servers can make the debugging of database performance issues harder - the proxy will add overhead for CPU and memory and MySQL may have to compete for those resources.

Additionally, we’re not really sure what you’d like to achieve by deploying ProxySQL on all database servers - where would you like to connect? To one instance or to both? In the first case, you’d have to come up with a solution to handling potentially hundreds of failovers - when a master goes down, you’d have to re-route traffic to the ProxySQL instance on a slave. It adds more complexity than it’s really worth. The second case also creates complexity: instead of connecting to one proxy, the application would have to connect to both.

Co-locating ProxySQL on the application hosts is not that much more complex regarding configuration management than deploying it on database hosts. Yet it makes it so much easier for the application to route traffic - just connect to the local ProxySQL instance over the UNIX socket and that’s all.

Q.: Do you recommend for multiple ProxySQL instances to talk to each other or is it preferable for config changes to rely on each ProxySQL instance detecting the same issue at the same time? For example, would you make ProxySQL01 apply config changes in proxysql_master_switchover.sh to both itself and ProxySQL02 to ensure they stay the same? (I hope this isn't a stupid question... I've not yet succeeded in making this work so I thought maybe I'm missing something!)

A.: This is a very good question indeed. As long as you have scripts which would ensure that the configuration is the same on all of the ProxySQL instances - it should result in more consistent configuration across the whole infrastructure.

Q.: Sometimes I get the following warning 2017-04-04T02:11:43.996225+02:00 Keepalived_vrrp: Process [113479] didn't respond to SIGTERM. and VIP was moved to another server ... I can send you the complete configuration keepalived ... I didn't find a solution as to why I am getting this error/warning.

A.: This may happen from time to time. Timeout results in a failed check which triggers VIP failover. And as to why the monitored process didn't respond to signal in time, that’s really hard to tell. It is possible to increase the number of health-check fails required to trigger a VIP move to minimize the impact of such timeouts.

Q.: What load balancer can we use in front of ProxySQL?

A.: You can use virtually every load balancer out there, including ProxySQL itself - this is actually a topology we’d suggest. It’s better to rely on a single piece of software than to use ProxySQL and then another tool which would be redundant - more steep learning curve, more issues to debug.

Q.: When I started using ProxySQL I had this issue "access denied for MySQL user"; it was random, what is the cause of it?

A.: If it is random and not systematic, it may be worth investigating if it is a bug. We strongly recommend to open an issue on github.

Q.: I have tried ProxySQL and the issue we faced was that after using ProxySQL to split read/write , the connection switched to Master for all reads. How can we prevent the connection?

A.: This is most likely a configuration issue, and there are multiple reasons why this may happen. For example, if transaction_persistent was set to 1 and reads were all within a transaction. Or perhaps the query rules in mysql_query_rules weren’t configured correctly, and all traffic was being sent to the default hostgroup (the master).

Q.: How can Service Discovery help me?

A.: If your infrastructure is constantly changing, tools like etcd, Zookeeper or Consul can help you to track those changes, detect and push configuration changes to proxies. When your database clusters are going up and down, this can simplify configuration management.

Q.: In the discussion on structure, the load balancer scenario was quickly moved on from because of its single point of failure. How about when having a HA load balancer using CNAMES (not IP) for example AWS ElasticLoadBalancer on TCP ports. Would that be a structure that could work well in production?

A.: As long as the load balancer is highly available, this is not a problem, because it’s not a single point of failure. ELB itself is deployed in HA mode, so having a single ELB in front of anything (database servers, a pool of ProxySQL instances) will not introduce a single point of failure.

Q.: Don't any of the silo approaches have a single point of failure in the proxy that is fronting the silo?

A.: Indeed, although it is not a single point of failure - it’s more like multiple points of failure introduced in the infrastructure. If we are talking about huge infrastructure of hundreds or thousands of proxies, a loss of very small subset of application hosts should be acceptable. If we are talking about smaller setups, it should be manageable to have a ProxySQL per application host setup.

Watch the webinar replay

Announcing ClusterControl 1.4.1 - the ProxySQL Edition

$
0
0

Today we are pleased to announce the 1.4.1 release of ClusterControl - the all-inclusive database management system that lets you easily deploy, monitor, manage and scale highly available open source databases - and load balancers - in any environment: on-premise or in the cloud.

This release contains key new management features for MySQL and MariaDB load balancing with ProxySQL, along with performance improvements and bug fixes.

Release Highlights

For ProxySQL

  • Support for:
    • MySQL Galera in addition to Replication clusters
    • Active-standby HA setup with Keepalived
    • Use the Query Monitor to view query digests
  • Management features:
    • Manage Query Rules (Query Caching, Query Rewrite)
    • Manage Host Groups (Servers)
    • Manage ProxySQL Database Users
    • Manage ProxySQL System Variables

For Galera Cluster for MySQL & Replication

  • Manage MySQL Galera and Replication clusters with management/public IPs
    • For monitoring connections and data/private IPs for replication traffic
  • Add MySQL Galera nodes or Replication Read Slaves with management and data IPs

Download ClusterControl

View release details and resources

Load balancers are an essential component in MySQL and MariaDB database high availability; especially when making topology changes transparent to applications and implementing read-write split functionality. As we all know, high-traffic database applications draw an enormous amount of queries daily. Which is why DBAs and SysAdmins require reliable technology solutions that can automatically scale to handle those connections while remaining available for still more.

And this is where load balancing technologies such as HAProxy, MaxScale and now ProxySQL come in.

ClusterControl has always come with support for HAProxy, as a generic TCP load balancer. We then added support for MariaDB’s MaxScale, an SQL-aware load balancer.

And today we’re happy to announce management support for ProxySQL, a lightweight yet complex protocol-aware proxy that sits between the MySQL clients and servers, in addition to the deployment and monitoring features for ProxySQL we announced two months ago.

Unlike others, ProxySQL understands MySQL protocol, which allows the implementation of features otherwise impossible to implement. For example, ProxySQL is the only proxy supporting connections multiplexing and query caching.

With that said, the new management features in ClusterControl include the following:

MySQL Galera in addition to Replication clusters

Up until now, ClusterControl enabled users to deploy ProxySQL on MySQL Replication clusters and monitor its performance. The same is now true for Galera Cluster for MySQL, MariaDB Galera Cluster and Percona XtraDB. This also includes active-standby HA setups with Keepalived.

Use the Query Monitor to view query digests

ClusterControl offers unified and comprehensive real-time monitoring of your entire database and server infrastructure. You can easily visualize performance in custom dashboards to establish operational baselines and support capacity planning. And with comprehensive reports for ProxySQL, you have a clear view of data points like connections, queries, data transfer and utilization, and more.

For more information on how monitoring works in ProxySQL, see our blog post on MySQL Load Balancing with ProxySQL - An Overview.

Management features

With ClusterControl, you can now easily configure and manage your ProxySQL deployments with its comprehensive UI. You can create servers, reorientate your setup, create users, set rules, manage query routing, and enable variable configurations. The new management features in ClusterControl for ProxySQL include:

Manage Query Rules (Query Caching, Query Rewrite)

  • View running queries, create rules or cache and rewrite queries on the fly.

Manage Host Groups (Servers) - ProxySQL uses a concept of hostgroups - a group of different backends which serve the same purpose or handle similar type of traffic.

  • Add or remove servers to existing and new host groups.

Manage ProxySQL Database Users

  • Create new DB users or add existing MySQL users to ProxySQL.

Manage ProxySQL System Variables

  • View and change global runtime variables for tweaking your ProxySQL instance.

For more information on how ProxySQL helps with MySQL query cache, query rewrite, and on ProxySQL’s host groups, read our blog on How ProxySQL adds Failover and Query Control to your MySQL Replication Setup.

There are a number of other features and improvements that we have not mentioned here. You can find all details in the ChangeLog.

We encourage you to test this latest release and provide us with your feedback. If you’d like a demo, feel free to request one.

Thank you for your ongoing support, and load balancing!

PS.: For additional tips & tricks, follow our blog: https://severalnines.com/blog/


How to deploy and manage HAProxy, MaxScale or ProxySQL with ClusterControl - Webinar May 9th

$
0
0

Join us for our new webinar next week, Tuesday May 9th, with Krzysztof Książek, Senior Support Engineer at Severalnines, who will discuss support for proxies for MySQL HA setups in ClusterControl: how they differ and what their pros and cons are. You’ll also be shown you how you can easily deploy and manage HAProxy, MaxScale and ProxySQL from ClusterControl via a live demo.

Proxies are building blocks of high availability setups for MySQL. They can detect failed nodes and route queries to hosts which are still available. If your master failed and you had to promote one of your slaves, proxies will detect such topology changes and route your traffic accordingly. More advanced proxies can do much more, such as route traffic based on precise query rules, cache queries or mirror them. They can be even used to implement different types of sharding.

Register below to hear it all about it!

Date, Time & Registration

Europe/MEA/APAC

Tuesday, May 9th at 09:00 BST (UK) / 10:00 CEST (Germany, France, Sweden)

Register Now

North America/LatAm

Tuesday, May 9th at 9:00 PST (US) / 12:00 EST (US)

Register Now

Agenda

  • Introduction
  • Why use a proxy layer?
  • Comparison of proxies - the pros & cons
    • HAProxy
    • MaxScale
    • ProxySQL
  • Live demo of proxy support in ClusterControl

Speaker

Krzysztof Książek, Senior Support Engineer at Severalnines, is a MySQL DBA with experience managing complex database environments for companies like Zendesk, Chegg, Pinterest and Flipboard.

We look forward to “seeing” you there and to insightful discussions!

If you have any questions or would like a personalised live demo, please do contact us.

Webinar Replay and Q&A: how to deploy and manage ProxySQL, HAProxy and MaxScale

$
0
0

Thanks to everyone who participated in yesterday’s webinar on how to deploy and manage ProxySQL, HAProxy and MaxScale with ClusterControl.

Krzysztof Książek, Senior Support Engineer at Severalnines, discussed support for proxies for MySQL HA setups in ClusterControl: how they differ and what their pros and cons are. And he demonstrated how you can easily deploy and manage HAProxy, MaxScale and ProxySQL from ClusterControl during a live demo.

If you missed the webinar, would like to watch it again or browse through the slides, it’s all available for viewing online now. You’ll also find below a transcript of the Q&A session, which took place at the end of the webinar.

Watch the webinar replay

Webinar Questions & Answers

Q.: I’d like to replace HAProxy by ProxySQL - can I deploy ProxySQL on the same VMs as my current HAProxy ones or do I have to create new VMs? I deploy and manage it all with ClusterControl.

A.: Yes, as long as there is no conflict in ports used by those two proxies, there’s no reason why they couldn’t coexist. By default there is no such conflict, but a user may customize ports when deploying a proxy from ClusterControl, so if you are not sure how HAProxy is configured, it’s better to double-check it.

Q.: Do you know what happened to the admin interface MaxScale 2.0 and why it was removed?

A.: We don’t have detailed knowledge - it’s been deprecated due to security reasons, but what exactly is hidden behind this statement, we don’t know.

Q.: Have you any plans to talk about or support other load balancers in future, such as F5 BigIP, A10 Networks, or Citrix Netscaler? Or do you have any immediate thoughts on them you can share just now?

A.: As of now we don’t have any plans related to these load balancers, but if we get more requests for it, we’ll look into them more.

Q.: How can we sync users across multiple Proxysql instances? Or add existing users automatically to a newly added Proxysql instance?

A.: As of now, it is not possible to do that using ClusterControl - you still can do it manually, accessing ProxySQL through the command line interface. Having said that, we have plans to implement configuration syncing in one of the next ClusterControl releases. For adding users in batches, right now, CLI is the best way - ProxySQL accepts passwords in a form of MySQL password hash, so it’s fairly easy to write a script which will do the import. This is one of the feature requests we got so we will, most likely, implement it at some point. We can’t share any ETA though.

Q.: How does ClusterControl handle configuration changes in ProxySQL?

A.: ClusterControl does not take advantage of multiple configuration levels in ProxySQL - any change introduced via the UI is immediately loaded to runtime configuration.

Q.: Can you describe what the CPU usage is for ProxySQL or MaxScale on read/write split?

A.: Typically you’ll see ProxySQL utilizing less CPU resources compared to MaxScale, but it all depends on your workload and the number of query rules you may have added to ProxySQL.

Watch the webinar replay

Comparing Oracle MySQL, Percona Server and MariaDB

$
0
0

Back in the days when somebody said MySQL, there was only the MySQL. You could pick different versions (4.0, 4.1) but the vendor was the same. This changed around MySQL 5.0/5.1 when Percona decided to release their own flavour of MySQL - Percona Server. A bit later, MariaDB joined with MariaDB 5.1 and the fun (or confusion) increased. What version should I use? What is the difference between MySQL 5.1, Percona Server 5.1 and MariaDB 5.1? Which one is faster? Which one is more stable? Which one has superior functionality? With time, this got worse as more and more changes were introduced in each of flavours. This blog post will be our attempt to summarize the key features that differentiate them. We will also try to give you some suggestions about which flavour may be the best for a given type of project. Let’s get started.

Oracle MySQL

It used to be the MySQL, now it’s the upstream. Most of the development starts here, each version starting from 5.6 resolves some internal contentions and brings better performance. New features are being added too on a regular basis. MySQL 5.6 brought us (among others) GTID and an initial implementation of parallel replication. It also gave us ability to execute most of the ALTERs in an online manner. Let’s take a look at the features of the latest MySQL version - MySQL 5.7

Features of MySQL 5.7

One of the major changes are changes in the deployment process - instead of different scripts, you can just run mysqld --initialize to set MySQL up from scratch. Another very important change - parallel replication based on logical clock. Finally, we can use parallel replication in all cases - no matter if you use multiple schemas or not. Another replication improvement is multi-source replication - a 5.7 slave can have multiple masters - it’s great feature if you want to build an aggregation slave and, let’s say, combine data from multiple, separate clusters.

InnoDB started to support spatial types, InnoDB buffer pool can finally be resized at runtime, online ALTERs have been improved to support more cases like partitioning and no-op ALTERs.

MySQL started to support JSON data types natively along with several new functions which are focused on adding functionality around JSON. Security of your data is very important these days, MySQL 5.7 supports data-at-rest encryption for file-per-table tablespaces. Some improvements have also been added to SSL support (SSL will be configured if keys are in place, a script is included which can be used to create certificates). From a user management perspective, password lifetime setup has been added which should make the design of password expiration policies a bit easier.

Another feature which is intended to assist DBAs is the ‘sys’ schema, a set of views designed to make it easier to use Performance Schema. It’s been included by default in MySQL 5.7.

Finally, MySQL Group Replication (and eventually MySQL InnoDB Cluster) has been added to MySQL 5.7. It works as a plugin and is included in recent versions of the 5.7 branch, but that is a topic of its own. In short, Group Replication allows you to build a “virtually” synchronous cluster.

This is definitely not a full list of features - if you are interested in all of them, you may want to consult MySQL 5.7 documentation.

Percona Server

At the beginning, there was a set of patches to apply to the MySQL source code which added some performance improvements and functionality. At some point, Percona decided to release their own build of MySQL which included these patches. In time, more development resources became available, so more and more features have been added.

In general, you can view Percona Server as the latest MySQL version with multiple patches/improvements. With time, some of the Percona Server feature improvements are replaced by features from the upstream - whenever Oracle develops a feature which supersedes one of functionalities added in Percona Server. As long as the implementation is on par, Percona removes their own code in favor of code from the upstream. This makes Percona Server basically a drop-in replacement for Oracle’s MySQL. One of the areas in which major performance improvements have been made is InnoDB. It’s been modified significantly enough to brand it as XtraDB. Currently it is fully compatible with InnoDB but it hasn’t always been like that. For instance, some features in Percona Server 5.5 were not compatible with MySQL 5.5. So you should exercise caution when you plan to migrate from Percona Server to MySQL.

What’s worth highlighting is that Percona strives to reimplement enterprise features of the upstream. In case of MySQL, examples are implementation of a thread pool or PAM authentication plugin. Let’s take a quick look at some of the features of the Percona Server.

Features of Percona Server 5.7

One of the main features of XtraDB is improved buffer pool scalability - even though there’s less and less contention due to the work Oracle does on every MySQL version, Percona’s engineering team strives to push performance even further and remove additional mutexes which may limit performance. Additionally, more data is written into InnoDB monitor (accessible via SHOW ENGINE INNODB STATUS) regarding contentions within InnoDB - e.g., a section on semaphores has been added.

Another set of improvements have been made in the area of I/O. In InnoDB, you can set a flush method only for InnoDB tablespaces and this causes double-buffering for InnoDB redo logs. XtraDB makes it possible to use O_DIRECT also for those files. It also adds more data regarding checkpointing to the output of SHOW ENGINE INNODB STATUS. Additionally to that, parallel doublewrite buffer and multi-threaded LRU flusher have been implemented to reduce contention in I/O operations within InnoDB.

Thread pool is another feature made available by Percona Server. In Oracle MySQL it’s available only in the Enterprise edition. Here you can use Percona’s implementation for free. In general, thread pool reduces contentions while serving high number of connections from the application by reusing existing connections to the database.

Two more features are direct replacements of features from the Enterprise version of MySQL. One of them is the PAM authentication plugin which has been developed by Percona and is designed to allow the use of plenty of different authentication options like LDAP, RSA SecurID or any other methods supported by PAM. Second feature is also related to security - audit log plugin. It will create a file with a record of actions taken on the database server.

From time to time, Percona introduces significant improvements to other storage engines like the changes they made in MEMORY engine which allowed VARCHAR or BLOB type of data to be used.

Introduction of backup locks was also a rather significant improvement. In Oracle and MariaDB the only method of locking the table to get a consistent backup was to use FLUSH TABLES WITH READ LOCK (FTWRL). It’s rather heavy and it forces MySQL to close all of the opened tables. Backup locks, on the other hand, use a more lightweight approach of metadata locks. In many cases of heavy loaded server running FTWRL takes too long (and locks the server for too long) to be considered feasible while backup locks make it possible to take a backup using mysqldump or xtrabackup.

Percona is open also on porting features from other vendors. One such example is port of MariaDB’s START TRANSACTION WITH CONSISTENT SNAPSHOTS. This feature is also related to backups - with its help, you can take a consistent logical backup (using mysqldump) without running FLUSH TABLE WITH READ LOCK.

Finally, three features which improve observability - first: user statistics. This is fairly light-weight feature which collects data about users, indexes, tables and threads. It allows you to find unused indexes or determine which user is responsible for the load on the server. Currently it’s partially redundant to performance_schema but it’s a bit lighter and it was created in the days of MySQL 5.0 - 5.1, where no one even dreamt about the performance_schema.

Second - enhanced slow query log. Again, it was added in times where the highest granularity of long_query_time was 1 second. With this addition you had microsecond granularity and a bunch of additional data about InnoDB stats per query or its overall performance characteristics. Did it create a temporary table? Did it use an index? Has it been cached in the MySQL query cache?

Third feature we mentioned couple of times above - Percona Server exposes significantly more data in SHOW ENGINE INNODB STATUS than upstream. It definitely helps to further understand the workload and catch more issues before they unfold.

Of course, this is not a full list - if you are interested in more details, you may want to check Percona Server’s documentation.

MariaDB

MariaDB started as a fork of MySQL but, with part of original MySQL development team joining MariaDB, it quickly focused on adding features. In MariaDB 5.3, lots of features had been added to the optimizer: Batch Key Access, MultiRange Read, Index Condition Pushdown to name a few. This allowed MariaDB to excel in some workloads where MySQL or Percona Server would struggle. Until now, some of those features have been added to MySQL (mostly in MySQL 5.6) but some are still unique to MariaDB.

Another important feature which was introduced by MariaDB was Global Transaction ID. Not too much later Oracle released its own implementation but MariaDB was the first to have it. Similar story is with another replication feature - multisource replication: MariaDB had it before Oracle. Now, recently released MariaDB 10.2 also contains features which will be made available in MySQL 8.0, which is still under development. We are talking about, for example, recursive common table expressions or window functions.

Features of MariaDB 10.2

As we mentioned, MariaDB 10.2 introduces window functions and recursive common table expressions - enhancements in SQL which should help developers to write more efficient SQL queries.

Very important change is that MariaDB 10.2 uses InnoDB. Up to 10.1, XtraDB has been used as the default storage. This, unfortunately, makes features added in latest XtraDB unavailable for MariaDB 10.2 users.

Improvements have been made in virtual columns - more limitations have been lifted in 10.2.

Finally, support for multiple triggers for the same event has been added - now you can create several, for example, ON UPDATE triggers on the same table.

Developers should benefit from JSON support, along with a couple of functions which are related to it. They should also like new functions which allows them to export spatial data into GeoJSON format. Talking about JSON, improvements have been made in EXPLAIN FORMAT=JSON output - more data is shown.

On security front, support for OpenSSL 1.1 and LibreSSL has been added.

Of course, this list is not complete and if you are interested into what has been added to MySQL 10.2, you may want to consult documentation.

Additionally to new features MariaDB 10.2 benefits from features implemented in previous versions. We’ll go through the most important ones.

The most important features of MariaDB 10.1

First of all, MariaDB since 10.1 comes bundled with Galera cluster - no need to install additional libraries, everything is ready to use.

MariaDB 10.1 brought implementation of data-at-rest encryption. Compared to the feature implemented in Oracle’s MySQL, MariaDB has it more extended. Not only it encrypts tablespaces but it also encrypts redo logs, temporary files and binary logs. This comes with some issues - CLI tools like mysqldump or xtrabackup can’t access binary logs and may have problems backing up encrypted instances (this is especially true for xtrabackup - quite recently MariaDB created xtrabackup fork called MariaDB Backup which supports data-at-rest encryption).

Ok, so which flavor I should use?

As it usually is, the correct answer would be: “It depends” :-) . We will share couple of our observations which may or may not help you to decide, but, at the end, it’s up to you to run benchmarks and find whatever option will work best for your environment and application.

First of all, let’s talk about the flow. Oracle releases new version - let’s say MySQL 5.7. Performance-wise, at that moment, this is the fastest MySQL flavor on the market. This is because only Oracle has enough resources to work on improving InnoDB to that extent. Within a couple of months (in case of 5.7, it was 4 months) Percona releases Percona Server 5.7 with their set of improvements - depending on the type of workload, it may deliver even better performance than the upstream. Finally, MariaDB adopts new upstream version and builds its new version on top of it.

This is how it looked like in a calendar (we are still talking about MySQL 5.7).

MySQL 5.7 GA: October 21st, 2015

Percona Server 5.7 GA: February 23rd, 2016

MariaDB 10.2 GA: May 23rd, 2017

Please note how long it took MariaDB to release a version based on MySQL 5.7 - all previous versions have been based on MySQL 5.6 and, obviously, delivered performance lower than MySQL 5.7. On the other hand, MariaDB 10.2 has been released with InnoDB replacing XtraDB. While it’s true that Oracle mostly closed the performance gap between MySQL and Percona Server, it’s still just “mostly”. As a result, MariaDB 10.2 may deliver performance lower than the one of Percona Server in some cases (and better in some other cases - due to optimizer work done in MariaDB 5.3, some of which hasn’t been recreated yet in MySQL).

Feature-wise, it’s more complex. MariaDB has been adding lots of features, so if you are interested into some of them, you may definitely consider using MariaDB. There is a downside of it too. Percona Server had a great deal of features differentiating it from upstream MySQL but when Oracle started to implement them in MySQL, Percona decided to depreciate their implementations in favor of using the implementation from upstream. This reduced the amount of code that’s different between MySQL and Percona Server, makes it easier to maintain Percona Server’s code and, what’s the most important, makes Percona Server 100% compatible with MySQL.

This is, unfortunately, not true for MariaDB. MariaDB introduced GTID first, that’s true, but after Oracle developed their version of GTID, MariaDB decided to stick to their own implementation. This blog is not the place to decide which implementation is better, but as a result we have to manage two different, incompatible GTID systems - it adds burden on any tool that manages replication and reduces interoperability. Sticking to replication - group commit and parallel replication: both Oracle and MariaDB have their own implementation and if you work with both of them, you need to learn them both to apply the required tuning - the knobs are different and work in a different way. Similar case is with virtual columns support - two different, not 100% compatible implementations which, as a result, made it not possible to easily dump data from MariaDB and load into Oracle’s MySQL (and vice versa) because the syntax is slightly different. So, should you decide to use a version of MariaDB for some brand new feature, you may end up getting stuck with it even if you’d like to migrate back to MySQL to use Oracle’s implementation. At best, migration would require much more effort to execute. Of course, if you stay in the one environment all the time, it may not affect you severely. But even then, a lack of compatibility will be noticeable for you, if only while you read blogs on the internet and find solutions that are not really applicable to your flavour of MySQL.

So, to sum it up - if you are interested in maintaining compatibility with MySQL, Percona Server (or MySQL itself, of course) would probably be the way to go. If you are interested in performance, as long as there is Percona Server built on top of the latest MySQL, it may be the way to go. Of course, you may want to benchmark MariaDB and see if your workload can’t benefit from some of optimizations which are still unique to MariaDB. Operational-wise, it’s probably good to stick to one of the environments (Oracle/Percona or MariaDB), whichever would work for you better. MySQL or Percona Server have an advantage in a way that they are more commonly used and it’s slightly easier to integrate them with external tools (because not all of the tools support all of the MariaDB features). If you would benefit from a new and shiny feature which has been just implemented in MariaDB, you should consider it, keeping in mind any potential compatibility issues and possible lower performance.

We hope this blog post gave you some ideas about different choices we have in MySQL world and different angles from which you can compare them. At the end of the day, it will be your task to decide what’s best for your setup. It may not be easy but then we still should be grateful that we have a choice and we can pick what works best for us.

Video: Interview with Krzysztof Książek on the Upcoming Webinar: MySQL Tutorial - Backup Tips for MySQL

$
0
0

We sat down with Severalnines Senior Support Engineer Krzysztof Książek to discuss the upcoming webinar MySQL Tutorial - Backup Tips for MySQL, MariaDB & Galera Cluster.

ClusterControl
Single Console for Your Entire Database Infrastructure
Find out what else is new in ClusterControl

ClusterControl for MySQL Backup

ClusterControl provides you with sophisticated backup and failover features with a point-and-click interface to easily restore your data if something goes wrong. These advanced automated failover and backup technologies ensure your mission critical applications achieve high availability with zero downtime.

ClusterControl allows you to...

  • Create Backups
  • Schedule Backups
  • Set backup configuration method
    • Enable compression
    • Use mysqldump, xtrabackup, or NBD backup
    • Use PIGZ for parallel gzip
  • Backup to multiple locations (including the cloud)
  • Enable automated failover
  • View logs

ClusterControl also offers backup support for MongoDB & PostgreSQL

Learn more about the backup features in ClusterControl for MySQL here.

Watch the tutorial: backup best practices for MySQL, MariaDB and Galera Cluster

$
0
0

Many thanks to everyone who registered and/or participated in Tuesday’s webinar on backup strategies and best practices for MySQL, MariaDB and Galera clusters led by Krzysztof Książek, Senior Support Engineer at Severalnines. If you missed the session, would like to watch it again or browse through the slides, they’re now online for viewing. Also check out the transcript of the Q&A session below.

Watch the webinar replay

Whether you’re a SysAdmin, DBA or DevOps professional operating MySQL, MariaDB or Galera clusters in production, you should make sure that your backups are scheduled, executed and regularly tested. Krzysztof shared some of his key best practice tips & tricks yesterday on how to do just that; including a live demo with ClusterControl. In short, this webinar replay shows you the pros and cons of different backup options and helps you pick the one that goes best with your environment.

Happy backuping!

Questions & Answers

Q. Can we control I/O while taking the backups with mysqldump and mysqldumper (I’ve used nice before, but it wasn’t helpful).

A. Theoretically it might be possible, although we haven’t really tested that. If you really want to apply some throttling then you may want to look into cgroups - it should help you to throttle I/O activity on a per-process basis.

Q. Can we take mydumper with ClusterControl and is ClusterControl is free software?

A. We don't currently support it, but you can always use it manually; ClusterControl doesn't prevent you from using this tool. There is a free community version of ClusterControl, yes, though its backup features are part of the commercial version. With the free community version you can deploy and monitor your database (clusters) as well as develop your own custom database advisors. You also have a one-month trial period that gives you access to all of ClusterControl’s features. You can find all the feature details here: https://severalnines.com/pricing

Q. Can xtrabackup work with data-at-rest encryption?

A. It can work with encrypted data in MySQL or Percona Server - it is because they encrypt only tablespaces, which xtrabackup just copies - it doesn’t have to access contents of tablespaces. MariaDB encrypts not only tablespaces but also, for example, InnoDB redo logs, which have to be accessed by xtrabackup - therefore xtrabackup cannot work with data-at-rest encryption as implemented in MariaDB. Because of this MariaDB Corporation forked xtrabackup into MariaDB Backup. This tool supports encryption done by MariaDB.

Q. Can you use mydumper for point-in-time recovery?

A. Yes, it is possible. mydumper can store GTID data so you can identify last applied transaction and use it as a starting position for processing binary logs.

Q. Is it a problem if we use binary logs with xtrabackup with start-datetime and end-datetime instead of start-position and end-position? We make a full backup on Fridays and every other day an incremental backup. When we need to recover we take the last full and all incremental backups and the binary logs from this day starting from 00:00 to NOW ... could there be a problem with apply-log?

A. In general, you should not use --start-datetime or --end-datetime when you want to reply binary log on the database. It’s not granular enough - it has a resolution of one second and there could be many transactions that happened during that second. You can use it to minimize timeframe to look for manually, but that’s all. If you want to replay binary logs, you should use --start-position and --end-position. Only this will precisely define from which event you will replay binlogs and on which event it’ll end up.

Q. Should I run the dump software on load balancer or one of the MySQL nodes?

A. Typically you’ll use it on MySQL nodes. Some of the tools can only do just that. For example, Xtrabackup - you have to run it locally, on the database host. You can stream output to another location, but it has to be started locally.

Q. Can we take partial backups with ClusterControl? And if yes, how can we restore a backup on a running instance?

A. Yes, you can take a partial backup using ClusterControl (you can backup separate schema using xtrabackup) but, as of now, you cannot restore a partial backup on a running instance. This is caused by the fact that the schema you’d recover will not be consistent with the rest of the cluster. To make it consistent, the cluster has to be bootstrapped from the node on which you restore a backup. So, technically, the node runs all the time but it’s a fairly heavy and invasive operation. This will change in the next version of ClusterControl in which you’d be able to restore backups on a separate host. From that host you could then dump contents of a restored schema using mysqldump (or mydumper) and restore it on a production cluster.

Q. Can you please share the mysqldumper command?

A. It’s rather hard to answer this question without doing copy and paste from the documentation, so we think it will be the best if we’d point you to the documentation: https://github.com/maxbube/mydumper/tree/master/docs

Watch the webinar replay

Tips & Tricks - DevOps Database Glossary for the MySQL Novice

$
0
0

When you need to work with a database that you are not 100% familiar with, you can be overwhelmed by the hundreds of metrics available. Which ones are the most important? What should I monitor, and why? What patterns in metrics should ring some alarm bells? In this blog post we will try to introduce you to some of the most important metrics to keep an eye on while running MySQL or MariaDB in production.

Com_* status counters

We will start with Com_* counters - those define the number and types of queries that MySQL executes. We are talking here about query types like SELECT, INSERT, UPDATE and many more. It is quite important to keep an eye on those as sudden spikes or unexpected drops may suggest something went wrong in the system.

Our all-inclusive database management system ClusterControl shows you this data related to the most common query types in the “Overview” section.

Handler_* status counters

A category of metrics you should keep an eye on are Handler_* counters in MySQL. Com_* counters tell you what kind of queries your MySQL instance is executing but one SELECT can be totally different to another - SELECT could be a primary key lookup, it can be also a table scan if an index cannot be used. Handlers tell you how MySQL access stored data - this is very useful for investigating the performance issues and assessing if there is a possible gain in query review and additional indexing.

As you can see from the graph above there are many metrics to track (and ClusterControl graphs the most important ones) - we won’t cover all of them here (you can find descriptions in MySQL documentation) but we’d like to highlight the most important ones.

Handler_read_rnd_next - whenever MySQL accesses a row without an index lookup, in sequential order, this counter will be increased. If in your workload handler_read_rnd_next is responsible for a high percentage of the whole traffic, it means that your tables, most likely, could use some additional indexes because MySQL does plenty of table scans.

Handler_read_next and handler_read_prev - those two counters are updated whenever MySQL does an index scan - forward or backward. Handler_read_first and handler_read_last may shed some more light onto what kind of index scans those are - if we are talking about full index scan (forward or backward), those two counters will be updated.

Handler_read_key - this counter, on the other hand, if its value is high, tells you that your tables are well indexed as many of the rows were accessed through an index lookup.

Replication lag

If you are working with MySQL replication, replication lag is a metric you definitely want to monitor. Replication lag is inevitable and you will have to deal with it, but to deal with it you need to understand why it happens. For that the first step will be to know _when_ it showed up.

Whenever you see a spike of the replication lag, you’d want to check other graphs to get more clues - why has it happened? What might have caused it? Reasons could be different - long, heavy DML’s, significant increase in number of DML’s executed in a short period of time, CPU or I/O limitations.

InnoDB I/O

There are a number of important metrics to monitor that related to the I/O.

In the graph above, you can see couple of metrics which tell you what kind of I/O InnoDB does - data writes and reads, redo log writes, fsyncs. Those metrics will help you to decide, for example, if replication lag was caused by a spike of I/O or maybe because of some other reason. It’s also important to keep track of those metrics and compare them with your hardware limitations - if you are getting close to the hardware limits of your disks, maybe it’s time to look into this before it has more serious effects on your database performance.

Severalnines
 
DevOps Guide to Database Management
Learn about what you need to know to automate and manage your open source databases

Galera metrics - flow control and queues

If you happen to use Galera Cluster (no matter which flavor you use), there are a couple more metrics you’d want to closely monitor, these are somewhat tied together. First of them are metrics related to flow control.

Flow control, in Galera, is a means to keep the cluster in sync. Whenever a node stalls and cannot keep up with the rest of the cluster, it starts to send flow control messages asking the remaining cluster nodes to slow down. This allows it to catch up. This reduces the performance of the cluster, so it is important to be able to tell which node and when it started to send flow control messages. This can explain some of the slowdowns experienced by users or limit the time window and host to use for further investigation.

Second set of metrics to monitor are the ones related to send and receive queues in Galera.

Galera nodes can cache writesets (transactions) if they cannot apply all of them immediately. If needed, they can also cache writesets which are about to be sent to other nodes (if a given node receives writes from the application). Both cases are symptoms of a slow down which, most likely, will result in flow control messages being sent, and require some investigation - why it happened, on which node, at what time?

This is, of course, just the tip of the iceberg when we consider all of the metrics MySQL makes available - still, you can’t go wrong if you start watching those we covered here, in addition to regular OS/hardware metrics like CPU, memory, disk utilization and state of the services.

DevOps Considerations for Production-ready Database Deployments

$
0
0

MySQL is easy to install and use, it has always been popular with developers and system administrators. On the other hand, deploying a production-ready MySQL environment for a business-critical enterprise workload is a different story. It can be a bit of a challenge, and requires in-depth knowledge of the database. In this blog post, we’ll discuss some of the steps which have to be taken before we can consider our MySQL deployment production-ready.

High Availability

If you belong to those lucky ones who can accept hours of downtime, you can stop reading here and skip to the next paragraph. For 99.999% of business-critical systems, it would not be acceptable. Therefore a production-ready deployment has to include high availability measures. Automated failover of the database instances, as well as a proxy layer which detects changes in topology and state of MySQL and routes traffic accordingly, would be a main requirement. There are numerous tools which can be used to build such environments, for instance MHA, MRM or ClusterControl.

Proxy layer

Master failure detection, automated failover and recovery - these are crucial when building a production-ready infrastructure. But on their own, it is not enough. There is still an application which will have to adapt to the topology change triggered by the failover. Of course, it is possible to code the application so it is aware of instance failures. This is a cumbersome and inflexible way of handling topology changes though. Here comes the database proxy - a middle layer between application and database. A proxy can hide the complexity of your database layer from the application - all the application does is to connect to the proxy and the proxy will take care of the rest. The proxy will route queries to a database instance, it will handle topology changes and re-route as necessary. A proxy can also be used to implement read-write split, relieving the application from one more complex case to cover. This creates another challenge - which proxy to use? How to configure it? How to monitor it? How to make it highly available, so it does not become a SPOF?

ClusterControl can assist here. It can be used to deploy different proxies to form a proxy layer: ProxySQL, HAProxy and MaxScale. It preconfigures proxies to make sure they will handle traffic correctly. It also makes it easy to implement any configuration changes if you need to customize proxy setup for your application. Read-write split can be configured using any of the proxies ClusterControl supports. ClusterControl also monitors the proxies, and will recover them in case of failures. The proxy layer can become a single point of failure, as automated recovery might not be enough - to address that, ClusterControl can deploy Keepalived and configure Virtual IP to automate failover.

Backups

Even if you do not need to implement high availability, you probably still have to care about your data. Backup is a must for almost every production database. Nothing else than a backup can save you from an accidental DROP TABLE or DROP SCHEMA (well, maybe a delayed replication slave, but only for some period of time). MySQL offers multiple methods of taking backups - mysqldump, xtrabackup, different types of snapshot (some available only with particular hardware or cloud provider). It’s not easy to design the correct backup strategy, decide on which tools to use and then script whole process so it will execute correctly. It’s not rocket science either, and requires careful planning and testing. Once a backup is taken, you are not done. Are you sure the backup can be restored, and the data is not garbage? Verifying your backups is time consuming, and perhaps not the most exciting thing you will have on your todo list. But it is still important, and needs to be done regularly.

ClusterControl has extensive backup and restore functionality. It supports mysqldump for logical backup and Percona Xtrabackup for physical backup - those tools can be used in almost every environment, either cloud or on-premises. It is possible to build a backup strategy with a mixture of logical and physical backups, incremental or full, in an online fashion.

Apart from recovery, it also has options to verify a backup - for instance restore it on a separate host in order to verify if the backup process works ok or not.

If you’d like to regularly keep an eye on the backups (and you would probably want to do this), ClusterControl has the ability to generate operational reports. The backup report helps you track executed backups, and informs if there were any issues while taking them.

Severalnines
 
DevOps Guide to Database Management
Learn about what you need to know to automate and manage your open source databases

Monitoring and trending

No deployment is production-ready without proper monitoring of the services. You want to make sure you will be alerted if some services become unavailable so you can take an action, investigate or start recovery procedures. Of course, you also want to have trending solution too. It can’t be stressed enough how important it is to have monitoring data for assessing the state of the infrastructure or for any investigation,either post-mortem or real-time monitoring of the state of services. Metrics are not equal in importance - if you are not very familiar with a particular database product, you most likely won’t know which are the most important metrics to collect and watch. Sure, you might be able to collect everything but when it comes to reviewing data, it’s hardly possible to go through hundreds of metrics per host - you need to know which of them you should focus on.

The open source world is full of tools designed to monitor and collect metrics from different databases - most of them would require you to integrate them with your overall monitoring infrastructure, chatops platform or oncall support tools (like PagerDuty). It might also be required to install and integrate multiple components - storage (some sort of time-series database), presentation layer and data collection tools.

ClusterControl is a bit of a different approach, as it is one single product with real-time monitoring, trending, and dashboards that show the most important details. Database advisors, which can be anything from simple configuration advice, warning on thresholds or more complex rules for predictions, would generally produce comprehensive recommendations.

Ability to scale-up

Databases tend to grow in size, and it is not unlikely that it would grow in terms of transaction volumes or number of users. The ability to scale out or up can be critical for production. Even if you do a great job in estimating your hardware requirements at the start of the product lifecycle, you will probably have to handle a growth phase - as long as your product is successful, that is (but that’s what we all plan for, right?). You have to have the means to easily scale-up your infrastructure to cope with incoming load. For stateless services like webservers, this is fairly easy - you just need to provision more instances using the latest production image or code from your version control tool. For stateful services like databases, it’s more tricky. You have to provision new instances using your current production data, set up replication or some form of clustering between the current and the new instances. This can be a complex process and to get it right, you need to have more in-depth knowledge of the clustering or replication model chosen.

ClusterControl, as the name suggests, provides extensive support for building out clustered or replicated database setups. The methods used are battle tested through thousands of deployments. It comes with a Command Line Interface (CLI) so it can be easily integrated with configuration management systems. Please keep it in mind, though, that you might not want to make changes to your pool of databases too often - provisioning of a new instance takes time and adds some overhead in existing databases. Therefore you may want to stay on a “over-provisioned” side a little bit so you will have some time to spin up new instance before your cluster gets overloaded.

All in all, there are several steps you still have to take after initial deployment, to make sure your environment is ready for production. With the right tools, it is much easier to get there.


Galera Cluster Comparison - Codership vs Percona vs MariaDB

$
0
0

Galera Cluster is a synchronous multi-master replication plugin for InnoDB or XtraDB storage engine. It offers a number of outstanding features that standard MySQL replication doesn’t - read-write to any cluster node, automatic membership control, automatic node joining, parallel replication on row-level, and still keeping the native look and feel of a MySQL server. This plug-in is open-source and developed by Codership as a patch for standard MySQL. Percona and MariaDB leverage the Galera library in Percona XtraDB Cluster (PXC) and MariaDB Server (MariaDB Galera Cluster for pre 10.1) respectively.

We often get the question - which version of Galera should I use? Percona? MariaDB? Codership? This is not an easy one, since they all use the same Galera plugin that is developed by Codership. Nevertheless, let’s give it a try.

In this blog post, we’ll compare the three vendors and their Galera Cluster releases. We will be using the latest stable version of each vendor available at the time of writing - Galera Cluster for MySQL 5.7.18, Percona XtraDB Cluster 5.7.18 and MariaDB 10.2.7 where all are shipped with InnoDB storage engine 5.7.18.

Database Release

A database vendor who wish to leverage Galera Cluster technology would need to incorporate the WriteSet Replication (wsrep) API patch into its server codebase. This will allow the Galera plugin to work as a wsrep provider, to communicate and replicate transactions (writesets in Galera terms) via a group communication protocol.

The following diagram illustrates the difference between the standalone MySQL server, MySQL Replication and Galera Cluster:

Codership releases the wsrep-patched version of Oracle’s MySQL. MySQL has already released MySQL 5.7 as General Availability (GA) since October 2015. However the first beta wsrep-patched for MySQL was released a year later around October 2016, then became GA in January 2017. It took more than a year to incorporate Galera Cluster into Oracle’s MySQL 5.7 release line.

Percona releases the wsrep-patched version of its Percona Server for MySQL called Percona XtraDB Cluster (PXC). Percona Server for MySQL comes with XtraDB storage engine (a drop-in replacement of InnoDB) and follows the upstream Oracle MySQL releases very closely (including all the bug fixes in it) with some additional features like MyRocks storage engine, TokuDB as well as Percona’s own bug fixes. In a way, you can think of it as an improved version of Oracle’s MySQL, embedded with Galera technology.

MariaDB releases the wsrep-patched version of its MariaDB Server, and it’s already embedded since MariaDB 10.1, where you don’t have to install separate packages for Galera. In the previous versions (5.5 and 10.0 particularly), the Galera variant’s of MariaDB is called MariaDB Galera Cluster (MGC) with separate builds. MariaDB has its own path of releases and versioning and does not follow any upstream like Percona does. The MariaDB server functionality has started diverging from MySQL, so it might not be as straightforward a replacement for MySQL. It still comes with a bunch of great features and performance improvements though.

System Status

Monitoring Galera nodes and the cluster requires the wsrep API to report several statuses, which is exposed through SHOW STATUS statement:

mysql> SHOW STATUS LIKE 'wsrep%';

PXC does have a number of extra statuses, if compared to other variants. The following list shows wsrep related status that can only be found in PXC:

  • wsrep_flow_control_interval
  • wsrep_flow_control_interval_low
  • wsrep_flow_control_interval_high
  • wsrep_flow_control_status
  • wsrep_cert_bucket_count
  • wsrep_gcache_pool_size
  • wsrep_ist_receive_status
  • wsrep_ist_receive_seqno_start
  • wsrep_ist_receive_seqno_current
  • wsrep_ist_receive_seqno_end

While MariaDB only has one extra wsrep status, if compared to the Galera version provided by Codership:

  • wsrep_thread_count

The above does not necessarily tell us that PXC is superior to the others. It means that you can get better insights with more statuses.

Configuration Options

Since Galera is part of MariaDB 10.1 and later, you have to explicitly enable the following option in the configuration file:

wsrep_ready=ON

Note that if you do not enable this option, the server will act as a standard MariaDB installation. For Codership and Percona, this option is enabled by default.

Some Galera-related variables are NOT available across all Galera variants:

Database ServerVariable name
Codership’s MySQL Galera Cluster 5.7.18, wsrep 25.12
  • wsrep_mysql_replication_bundle
  • wsrep_preordered
  • wsrep_reject_queries
Percona XtraDB Cluster 5.7.18, wsrep 29.20
  • wsrep_preordered
  • wsrep_reject_queries
  • pxc_encrypt_cluster_traffic
  • pxc_maint_mode
  • pxc_maint_transition_period
  • pxc_strict_mode
MariaDB 10.2.7, wsrep 25.19
  • wsrep_gtid_domain_id
  • wsrep_gtid_mode
  • wsrep_mysql_replication_bundle
  • wsrep_patch_version

The above list might change once the vendor releases a new version. The only point that we would like to highlight here is, do not expect that Galera nodes hold the same set of configuration parameters across all variants. Some configuration variables were introduced by a vendor to specifically complement and improve the database server.

Contributions and Improvements

Database performance is not easily comparable, as it can vary a lot depending on the workloads. For general workloads, the replication performance are fairly similar across all variants. Under some specific workloads, it could be different.

Looking at the latest claims, Percona did an amazing job improving IST performance up to 4x as well as the commit operation. MariaDB also contributes a number of useful features for example WSREP_INFO plugin. On the other hand, Codership is focusing more on core Galera issues issues, including bug fixing and new features. Galera 4.0 has features like intelligent donor selection, huge transaction support, and non-blocking DDL.

The introduction of Percona Xtrabackup (a.k.a xtrabackup) as part of Galera’s SST has improved the SST performance significantly. The syncing process becomes faster and non-blocking to the donor. MariaDB then came up with its own xtrabackup fork called MariaDB Backup (mariabackup) which supported by Galera’s SST method through variable wsrep_sst_method=mariabackup. It also supports installation on Microsoft Windows.

Support

All Galera Cluster variants software are open-source and available for free. This includes the syncing software supported by Galera like mysqldump, rsync, Percona Xtrabackup and MariaDB Backup. For community users, you can seek for support, ask for questions, file a bug report, feature request or even make a pull request to the vendor’s respective support channels:

 CodershipPerconaMariaDB
Database server public issue trackerMySQL wsrep on GithubPercona XtraDB Cluster on LaunchpadMariaDB Server on JIRA
Galera issue trackerGalera on Github
DocumentationGalera Cluster DocumentationPercona XtraDB Cluster DocumentationMariaDB Documentation
Support forumCodership Team GroupsPercona ForumMariaDB Open Questions

Each vendor provides commercial support services.

Summary

We hope that this comparison gives you a clearer picture and helps you determine which vendor that better suits your need. They all use pretty much the same wsrep libraries, the differences would be mainly on the server side - for instance, if you want to leverage some specific features in MariaDB or Percona Server. You might want to check out this blog that compares the different servers (Oracle MySQL, MariaDB and Percona Server). ClusterControl supports all of the three vendors, so you can easily deploy different clusters and compare them yourself with your own workload, on your own hardware. Do give it a try.

New Tutorial: MySQL & MariaDB Load Balancing with ProxySQL

$
0
0

Severalnines is pleased to announce the launch of our new tutorial Database Load Balancing for MySQL and MariaDB with ProxySQL.

ProxySQL is a lightweight yet complex protocol-aware proxy that sits between the MySQL clients and servers. It is a gate, which basically separates clients from databases, and is therefore an entry point used to access all the database servers.

Included in this new tutorial….

  • Introduction to ProxySQL
  • Deep dive into ProxySQL concepts
  • How to install ProxySQL using ClusterControl
  • How to manage ProxySQL using ClusterControl
  • Managing multiple ProxySQL instances
  • ProxySQL failover handling
  • Use Cases including caching, rewriting, redirection and sharding

Load balancing and high availability go hand-in-hand, without it you are left with a single point of entry for your database and any spike in traffic could cause your setup to crash. ClusterControl makes it easy to deploy and configure several different load balancing technologies for MySQL and MariaDB, including ProxySQL, with a point-and-click graphical interface.

Check out our new tutorial to learn how to take advantage of this exciting new technology.

ClusterControl
Single Console for Your Entire Database Infrastructure
Find out what else is new in ClusterControl

ClusterControl for ProxySQL

ProxySQL enables MySQL, MariaDB and Percona XtraDB database systems to easily manage intense, high-traffic database applications without losing availability. ClusterControl offers advanced, point-and-click configuration management features for the load balancing technologies we support. We know the issues regularly faced and make it easy to customize and configure the load balancer for your unique application needs.

We are big fans of load balancing, and consider it to be an integral part of the database stack. ClusterControl has many things preconfigured to get you started with a couple of clicks. If you run into challenged we also provide resources and on-the-spot support to help ensure your configurations are running at peak performance.

ClusterControl delivers on an array of features to help deploy and manage ProxySQL

  • Advanced Graphical Interface - ClusterControl provides the only GUI on the market for the easy deployment, configuration and management of ProxySQL.
  • Point and Click deployment - With ClusterControl you’re able to apply point and click deployments to MySQL, MySQL replication, MySQL Cluster, Galera Cluster, MariaDB, MariaDB Galera Cluster, and Percona XtraDB technologies, as well the top related load balancers with HAProxy, MaxScale and ProxySQL.
  • Suite of monitoring graphs - With comprehensive reports you have a clear view of data points like connections, queries, data transfer and utilization, and more.

Configuration Management - Easily configure and manage your ProxySQL deployments with a simple UI. With ClusterControl you can create servers, reorientate your setup, create users, set rules, manage query routing, and enable variable configurations.

[Updated] Monitoring Galera Cluster for MySQL or MariaDB - Understanding metrics and their meaning

$
0
0

To operate any database efficiently, you need to have insight into database performance. This might not be obvious when everything is going well, but as soon as something goes wrong, access to information can be instrumental in quickly and correctly diagnosing the problem.

All databases make some of their internal status data available to users. In MySQL, you can get this data mostly by running 'SHOW STATUS' and 'SHOW GLOBAL STATUS', by executing 'SHOW ENGINE INNODB STATUS', checking information_schema tables and, in newer versions, by querying performance_schema tables.

These methods are far from convenient in day-to-day operations, hence the popularity of different monitoring and trending solutions. Tools like Nagios/Icinga are designed to watch hosts/services, and alert when a service falls outside an acceptable range. Other tools such as Cacti and Munin provide a graphical look at host/service information, and give historical context to performance and usage. ClusterControl combines these two types of monitoring, so we’ll have a look at the information it presents, and how we should interpret it.

If you’re using Galera Cluster (MySQL Galera Cluster by Codership or MariaDB Cluster or Percona XtraDB Cluster), you may have noticed the following section in ClusterControl’s "Overview" tab:

Let’s see, step by step, what kind of data we have here.

The first column contains the list of nodes with their IP addresses - there’s not much else to say about it.

Second column is more interesting - it describes node status (wsrep_local_state_comment status). A node can be in different states:

  • Initialized - The node is up and running, but it’s not a part of a cluster. It can be caused, for example, by network issues;
  • Joining - The node is in the process of joining the cluster and it’s either receiving or requesting a state transfer from one of other nodes;
  • Donor/Desynced - The node serves as a donor to some other node which is joining the cluster;
  • Joined - The node is joined the cluster but its busy catching up on committed write sets;
  • Synced - The node is working normally.

In the same column within the bracket is the cluster status (wsrep_cluster_status status). It can have three distinct states:

  • Primary - The communication between nodes is working and quorum is present (majority of nodes is available)
  • Non-Primary - The node was a part of the cluster but, for some reason, it lost contact with the rest of the cluster. As a result, this node is considered inactive and it won’t accept queries
  • Disconnected - The node could not establish group communication.

"WSREP Cluster Size / Ready" tells us about a cluster size as the node sees it, and whether the node is ready to accept queries. Non-Primary components create a cluster with size of 1 and wsrep readiness is OFF.

Let’s take a look at the screenshot above, and see what it is telling us about Galera. We can see three nodes. Two of them (192.168.55.171 and 192.168.55.173) are perfectly fine, they are both "Synced" and the cluster is in "Primary" state. The cluster currently consists of two nodes. Node 192.168.55.172 is "Initialized" and it forms "non-Primary" component. It means that this node lost connection with the cluster - most likely some kind of network issues (in fact, we used iptables to block a traffic to this node from both 192.168.55.171 and 192.168.55.173).

At this moment we have to stop a bit and describe how Galera Cluster works internally. We’ll not go into too much details as it is not within a scope of this blog post but some knowledge is required to understand the importance of the data presented in next columns.

Galera is a "virtually" synchronous, multi-master cluster. It means that you should expect data to be transferred across nodes "virtually" at the same time (no more annoying issues with lagging slaves) and that you can write to any node in a cluster (no more annoying issues with promoting a slave to master). To accomplish that, Galera uses writesets - atomic set of changes that are replicated across the cluster. A writeset can contain several row changes and additional needed information like data regarding locking.

Once a client issues COMMIT, but before MySQL actually commits anything, a writeset is created and sent to all nodes in the cluster for certification. All nodes check whether it’s possible to commit the changes or not (as changes may interfere with other writes executed, in the meantime, directly on another node). If yes, data is actually committed by MySQL, if not, rollback is executed.

What’s important to remember is the fact that nodes, similar to slaves in regular replication, may perform differently - some may have better hardware than others, some may be more loaded than others. Yet Galera requires them to process the writesets in a short and quick manner, in order to maintain "virtual" synchronization. There has to be a mechanism which can throttle the replication and allow slower nodes to keep up with the rest of the cluster.

Let's take a look at "Local Send Q [now/avg]" and "Local Receive Q [now/avg]" columns. Each node has a local queue for sending and receiving writesets. It allows to parallelize some of the writes and queue data which couldn’t be processed at once if node cannot keep up with traffic. In SHOW GLOBAL STATUS we can find eight counters describing both queues, four counters per queue:

  • wsrep_local_send_queue - current state of the send queue
  • wsrep_local_send_queue_min - minimum since FLUSH STATUS
  • wsrep_local_send_queue_max - maximum since FLUSH STATUS
  • wsrep_local_send_queue_avg - average since FLUSH STATUS
  • wsrep_local_recv_queue - current state of the receive queue
  • wsrep_local_recv_queue_min - minimum since FLUSH STATUS
  • wsrep_local_recv_queue_max - maximum since FLUSH STATUS
  • wsrep_local_recv_queue_avg - average since FLUSH STATUS

The above metrics are unified across nodes under ClusterControl -> Performance -> DB Status:

ClusterControl displays "now" and "average" counters, as they are the most meaningful as a single number (you can also create custom graphs based on variables describing the current state of the queues) . When we see that one of the queues is rising, this means that the node can’t keep up with the replication and other nodes will have to slow down to allow it to catch up. We’d recommend to investigate a workload of that given node - check the process list for some long running queries, check OS statistics like CPU utilization and I/O workload. Maybe it’s also possible to redistribute some of the traffic from that node to the rest of the cluster.

"Flow Control Paused" shows information about the percentage of time a given node had to pause its replication because of too heavy load. When a node can’t keep up with the workload it sends Flow Control packets to other nodes, informing them they should throttle down on sending writesets. In our screenshot, we have value of ‘0.30’ for node 192.168.55.172. This means that almost 30% of the time this node had to pause the replication because it wasn’t able to keep up with writeset certification rate required by other nodes (or simpler, too many writes hit it!). As we can see, it’s "Local Receive Q [avg]" points us also to this fact.

Next column, "Flow Control Sent" gives us information about how many Flow Control packets a given node sent to the cluster. Again, we see that it’s node 192.168.55.172 which is slowing down the cluster.

What can we do with this information? Mostly, we should investigate what’s going on in the slow node. Check CPU utilization, check I/O performance and network stats. This first step helps to assess what kind of problem we are facing.

In this case, once we switch to CPU Usage tab, it becomes clear that extensive CPU utilization is causing our issues. Next step would be to identify the culprit by looking into PROCESSLIST (Query Monitor -> Running Queries -> filter by 192.168.55.172) to check for offending queries:

Or, check processes on the node from operating system’s side (Nodes -> 192.168.55.172 -> Top) to see if the load is not caused by something outside of Galera/MySQL.

In this case, we have executed mysqld command through cpulimit, to simulate slow CPU usage specifically for mysqld process by limiting it to 30% out of 400% available CPU (the server has 4 cores).

"Cert Deps Distance" column gives us information about how many writesets, on average, can be applied in parallel. Writesets can, sometimes, be executed at the same time - Galera takes advantage of this by using multiple wsrep_slave_threads to apply writesets. This column gives you some idea how many slave threads you could use on your workload. It’s worth noting that there’s no point in setting up wsrep_slave_threads variable to values higher than you see in this column or in wsrep_cert_deps_distance status variable, on which "Cert Deps Distance" column is based. Another important note - there is no point either in setting wsrep_slave_threads variable to more than number of cores your CPU has.

"Segment ID" - this column will require some more explanation. Segments are a new feature added in Galera 3.0. Before this version, writesets were exchanged between all nodes. Let’s say we have two datacenters:

This kind of chatter works ok on local networks but WAN is a different story - certification slows down due to increased latency, additional costs are generated because of network bandwidth used for transferring writesets between every member of the cluster.

With the introduction of "Segments", things changed. You can assign a node to a segment by modifying wsrep_provider_options variable and adding "gmcast.segment=x" (0, 1, 2) to it. Nodes with the same segment number are treated as they are in the same datacenter, connected by local network. Our graph then becomes different:

The main difference is that it’s no more everyone to everyone communication. Within each segment, yes - it’s still the same mechanism but both segments communicate only through a single connection between two chosen nodes. In case of downtime, this connection will failover automatically. As a result, we get less network chatter and less bandwidth usage between remote datacenters. So, basically, "Segment ID" column tells us to which segment a node is assigned.

"Last Committed" column gives us information about the sequence number of the writeset that was last executed on a given node. It can be useful in determining which node is the most current one if there’s a need to bootstrap the cluster.

Rest of the columns are self-explanatory: Server version, uptime of a node and when the status was updated.

As you can see, the "Galera Nodes" section of the "Nodes/Hosts Stats" in the "Overview" tab gives you a pretty good understanding of the cluster’s health - whether it forms a "Primary" component, how many nodes are healthy, are there any performance issues with some nodes and if yes, which node is slowing down the cluster.

This set of data comes in very handy when you operate your Galera cluster, so hopefully, no more flying blind :-)

How to Automate Galera Cluster Using the ClusterControl CLI

$
0
0

As sysadmins and developers, we spend a lot our time in a terminal. So we brought ClusterControl to the terminal with our command line interface tool called s9s. s9s provides an easy interface to the ClusterControl RPC v2 API. You will find it very useful when working with large scale deployments, as the CLI allows will allow you to design more complex features and workflows.

This blog post showcases how to use s9s to automate the management of Galera Cluster for MySQL or MariaDB, as well as a simple master-slave replication setup.

Setup

You can find installation instructions for your particular OS in the documentation. What’s important to note is that if you happen to use the latest s9s-tools, from GitHub, there’s a slight change in the way you create a user. The following command will work fine:

s9s user --create --generate-key --controller="https://localhost:9501" dba

In general, there are two steps required if you want to configure CLI locally on the ClusterControl host. First, you need to create a user and then make some changes in the configuration file - all the steps are included in the documentation.

Deployment

Once the CLI has been configured correctly and has SSH access to your target database hosts, you can start the deployment process. At the time of writing, you can use the CLI to deploy MySQL, MariaDB and PostgreSQL clusters. Let’s start with an example of how to deploy Percona XtraDB Cluster 5.7. A single command is required to do that.

s9s cluster --create --cluster-type=galera --nodes="10.0.0.226;10.0.0.227;10.0.0.228"  --vendor=percona --provider-version=5.7 --db-admin-passwd="pass" --os-user=root --cluster-name="PXC_Cluster_57" --wait

Last option “--wait” means that the command will wait until the job completes, showing its progress. You can skip it if you want - in that case, the s9s command will return immediately to shell after it registers a new job in cmon. This is perfectly fine as cmon is the process which handles the job itself. You can always check the progress of a job separately, using:

root@vagrant:~# s9s job --list -l
--------------------------------------------------------------------------------------
Create Galera Cluster
Installing MySQL on 10.0.0.226                                           [██▊       ]
                                                                                                                                                                                                         26.09%
Created   : 2017-10-05 11:23:00    ID   : 1          Status : RUNNING
Started   : 2017-10-05 11:23:02    User : dba        Host   :
Ended     :                        Group: users
--------------------------------------------------------------------------------------
Total: 1

Let’s take a look at another example. This time we’ll create a new cluster, MySQL replication: simple master - slave pair. Again, a single command is enough:

root@vagrant:~# s9s cluster --create --nodes="10.0.0.229?master;10.0.0.230?slave" --vendor=percona --cluster-type=mysqlreplication --provider-version=5.7 --os-user=root --wait
Create MySQL Replication Cluster
/ Job  6 FINISHED   [██████████] 100% Cluster created

We can now verify that both clusters are up and running:

root@vagrant:~# s9s cluster --list --long
ID STATE   TYPE        OWNER GROUP NAME           COMMENT
 1 STARTED galera      dba   users PXC_Cluster_57 All nodes are operational.
 2 STARTED replication dba   users cluster_2      All nodes are operational.
Total: 2

Of course, all of this is also visible via the GUI:

Now, let’s add a ProxySQL loadbalancer:

root@vagrant:~# s9s cluster --add-node --nodes="proxysql://10.0.0.226" --cluster-id=1
WARNING: admin/admin
WARNING: proxy-monitor/proxy-monitor
Job with ID 7 registered.

This time we didn’t use ‘--wait’ option so, if we want to check the progress, we have to do it on our own. Please note that we are using a job ID which was returned by the previous command, so we’ll obtain information on this particular job only:

root@vagrant:~# s9s job --list --long --job-id=7
--------------------------------------------------------------------------------------
Add ProxySQL to Cluster
Waiting for ProxySQL                                                     [██████▋   ]
                                                                            65.00%
Created   : 2017-10-06 14:09:11    ID   : 7          Status : RUNNING
Started   : 2017-10-06 14:09:12    User : dba        Host   :
Ended     :                        Group: users
--------------------------------------------------------------------------------------
Total: 7

Scaling out

Nodes can be added to our Galera cluster via a single command:

s9s cluster --add-node --nodes 10.0.0.229 --cluster-id 1
Job with ID 8 registered.
root@vagrant:~# s9s job --list --job-id=8
ID CID STATE  OWNER GROUP CREATED  RDY  TITLE
 8   1 FAILED dba   users 14:15:52   0% Add Node to Cluster
Total: 8

Something went wrong. We can check what exactly happened:

root@vagrant:~# s9s job --log --job-id=8
addNode: Verifying job parameters.
10.0.0.229:3306: Adding host to cluster.
10.0.0.229:3306: Testing SSH to host.
10.0.0.229:3306: Installing node.
10.0.0.229:3306: Setup new node (installSoftware = true).
10.0.0.229:3306: Detected a running mysqld server. It must be uninstalled first, or you can also add it to ClusterControl.

Right, that IP is already used for our replication server. We should have used another, free IP. Let’s try that:

root@vagrant:~# s9s cluster --add-node --nodes 10.0.0.231 --cluster-id 1
Job with ID 9 registered.
root@vagrant:~# s9s job --list --job-id=9
ID CID STATE    OWNER GROUP CREATED  RDY  TITLE
 9   1 FINISHED dba   users 14:20:08 100% Add Node to Cluster
Total: 9

Managing

Let’s say we want to take a backup of our replication master. We can do that from the GUI but sometimes we may need to integrate it with external scripts. ClusterControl CLI would make a perfect fit for such case. Let’s check what clusters we have:

root@vagrant:~# s9s cluster --list --long
ID STATE   TYPE        OWNER GROUP NAME           COMMENT
 1 STARTED galera      dba   users PXC_Cluster_57 All nodes are operational.
 2 STARTED replication dba   users cluster_2      All nodes are operational.
Total: 2

Then, let’s check the hosts in our replication cluster, with cluster ID 2:

root@vagrant:~# s9s nodes --list --long --cluster-id=2
STAT VERSION       CID CLUSTER   HOST       PORT COMMENT
soM- 5.7.19-17-log   2 cluster_2 10.0.0.229 3306 Up and running
soS- 5.7.19-17-log   2 cluster_2 10.0.0.230 3306 Up and running
coC- 1.4.3.2145      2 cluster_2 10.0.2.15  9500 Up and running

As we can see, there are three hosts that ClusterControl knows about - two of them are MySQL hosts (10.0.0.229 and 10.0.0.230), the third one is the ClusterControl instance itself. Let’s print only the relevant MySQL hosts:

root@vagrant:~# s9s nodes --list --long --cluster-id=2 10.0.0.2*
STAT VERSION       CID CLUSTER   HOST       PORT COMMENT
soM- 5.7.19-17-log   2 cluster_2 10.0.0.229 3306 Up and running
soS- 5.7.19-17-log   2 cluster_2 10.0.0.230 3306 Up and running
Total: 3

In the “STAT” column you can see some characters there. For more information, we’d suggest to look into the manual page for s9s-nodes (man s9s-nodes). Here we’ll just summarize the most important bits. First character tells us about the type of the node: “s” means it’s regular MySQL node, “c” - ClusterControl controller. Second character describes the state of the node: “o” tells us it’s online. Third character - role of the node. Here “M” describes a master and “S” - a slave while “C” stands for controller. Final, fourth character tells us if the node is in maintenance mode. “-” means there’s no maintenance scheduled. Otherwise we’d see “M” here. So, from this data we can see that our master is a host with IP: 10.0.0.229. Let’s take a backup of it and store it on the controller.

root@vagrant:~# s9s backup --create --nodes=10.0.0.229 --cluster-id=2 --backup-method=xtrabackupfull --wait
Create Backup
| Job 12 FINISHED   [██████████] 100% Command ok

We can then verify if it indeed completed ok. Please note the “--backup-format” option which allows you to define which information should be printed:

root@vagrant:~# s9s backup --list --full --backup-format="Started: %B Completed: %E Method: %M Stored on: %S Size: %s %F\n" --cluster-id=2
Started: 15:29:11 Completed: 15:29:19 Method: xtrabackupfull Stored on: 10.0.0.229 Size: 543382 backup-full-2017-10-06_152911.xbstream.gz
Total 1
Severalnines
 
DevOps Guide to Database Management
Learn about what you need to know to automate and manage your open source databases

Monitoring

All databases have to be monitored. ClusterControl uses advisors to watch some of the metrics on both MySQL and the operating system. When a condition is met, a notification is sent. ClusterControl provides also an extensive set of graphs, both real-time as well as historical ones for post-mortem or capacity planning. Sometimes it would be great to have access to some of those metrics without having to go through the GUI. ClusterControl CLI makes it possible through the s9s-node command. Information on how to do that can be found in the manual page of s9s-node. We’ll show some examples of what you can do with CLI.

First of all, let’s take a look at the “--node-format” option to “s9s node” command. As you can see, there are plenty of options to print interesting content.

root@vagrant:~# s9s node --list --node-format "%N %T %R %c cores %u%% CPU utilization %fmG of free memory, %tMB/s of net TX+RX, %M\n""10.0.0.2*"
10.0.0.226 galera none 1 cores 13.823200% CPU utilization 0.503227G of free memory, 0.061036MB/s of net TX+RX, Up and running
10.0.0.227 galera none 1 cores 13.033900% CPU utilization 0.543209G of free memory, 0.053596MB/s of net TX+RX, Up and running
10.0.0.228 galera none 1 cores 12.929100% CPU utilization 0.541988G of free memory, 0.052066MB/s of net TX+RX, Up and running
10.0.0.226 proxysql  1 cores 13.823200% CPU utilization 0.503227G of free memory, 0.061036MB/s of net TX+RX, Process 'proxysql' is running.
10.0.0.231 galera none 1 cores 13.104700% CPU utilization 0.544048G of free memory, 0.045713MB/s of net TX+RX, Up and running
10.0.0.229 mysql master 1 cores 11.107300% CPU utilization 0.575871G of free memory, 0.035830MB/s of net TX+RX, Up and running
10.0.0.230 mysql slave 1 cores 9.861590% CPU utilization 0.580315G of free memory, 0.035451MB/s of net TX+RX, Up and running

With what we shown here, you probably can imagine some cases for automation. For example, you can watch the CPU utilization of the nodes and if it reaches some threshold, you can execute another s9s job to spin up a new node in the Galera cluster. You can also, for example, monitor memory utilization and send alerts if it passess some threshold.

The CLI can do more than that. First of all, it is possible to check the graphs from within the command line. Of course, those are not as feature-rich as graphs in the GUI, but sometimes it’s enough just to see a graph to find an unexpected pattern and decide if it is worth further investigation.

root@vagrant:~# s9s node --stat --cluster-id=1 --begin="00:00" --end="14:00" --graph=load 10.0.0.231
root@vagrant:~# s9s node --stat --cluster-id=1 --begin="00:00" --end="14:00" --graph=sqlqueries 10.0.0.231

During emergency situations, you may want to check resource utilization across the cluster. You can create a top-like output that combines data from all of the cluster nodes:

root@vagrant:~# s9s process --top --cluster-id=1
PXC_Cluster_57 - 14:38:01                                                                                                                                                               All nodes are operational.
4 hosts, 7 cores,  2.2 us,  3.1 sy, 94.7 id,  0.0 wa,  0.0 st,
GiB Mem : 2.9 total, 0.2 free, 0.9 used, 0.2 buffers, 1.6 cached
GiB Swap: 3 total, 0 used, 3 free,

PID   USER       HOST       PR  VIRT      RES    S   %CPU   %MEM COMMAND
 8331 root       10.0.2.15  20   743748    40948 S  10.28   5.40 cmon
26479 root       10.0.0.226 20   278532     6448 S   2.49   0.85 accounts-daemon
 5466 root       10.0.0.226 20    95372     7132 R   1.72   0.94 sshd
  651 root       10.0.0.227 20   278416     6184 S   1.37   0.82 accounts-daemon
  716 root       10.0.0.228 20   278304     6052 S   1.35   0.80 accounts-daemon
22447 n/a        10.0.0.226 20  2744444   148820 S   1.20  19.63 mysqld
  975 mysql      10.0.0.228 20  2733624   115212 S   1.18  15.20 mysqld
13691 n/a        10.0.0.227 20  2734104   130568 S   1.11  17.22 mysqld
22994 root       10.0.2.15  20    30400     9312 S   0.93   1.23 s9s
 9115 root       10.0.0.227 20    95368     7192 S   0.68   0.95 sshd
23768 root       10.0.0.228 20    95372     7160 S   0.67   0.94 sshd
15690 mysql      10.0.2.15  20  1102012   209056 S   0.67  27.58 mysqld
11471 root       10.0.0.226 20    95372     7392 S   0.17   0.98 sshd
22086 vagrant    10.0.2.15  20    95372     4960 S   0.17   0.65 sshd
 7282 root       10.0.0.226 20        0        0 S   0.09   0.00 kworker/u4:2
 9003 root       10.0.0.226 20        0        0 S   0.09   0.00 kworker/u4:1
 1195 root       10.0.0.227 20        0        0 S   0.09   0.00 kworker/u4:0
27240 root       10.0.0.227 20        0        0 S   0.09   0.00 kworker/1:1
 9933 root       10.0.0.227 20        0        0 S   0.09   0.00 kworker/u4:2
16181 root       10.0.0.228 20        0        0 S   0.08   0.00 kworker/u4:1
 1744 root       10.0.0.228 20        0        0 S   0.08   0.00 kworker/1:1
28506 root       10.0.0.228 20    95372     7348 S   0.08   0.97 sshd
  691 messagebus 10.0.0.228 20    42896     3872 S   0.08   0.51 dbus-daemon
11892 root       10.0.2.15  20        0        0 S   0.08   0.00 kworker/0:2
15609 root       10.0.2.15  20   403548    12908 S   0.08   1.70 apache2
  256 root       10.0.2.15  20        0        0 S   0.08   0.00 jbd2/dm-0-8
  840 root       10.0.2.15  20   316200     1308 S   0.08   0.17 VBoxService
14694 root       10.0.0.227 20    95368     7200 S   0.00   0.95 sshd
12724 n/a        10.0.0.227 20     4508     1780 S   0.00   0.23 mysqld_safe
10974 root       10.0.0.227 20    95368     7400 S   0.00   0.98 sshd
14712 root       10.0.0.227 20    95368     7384 S   0.00   0.97 sshd
16952 root       10.0.0.227 20    95368     7344 S   0.00   0.97 sshd
17025 root       10.0.0.227 20    95368     7100 S   0.00   0.94 sshd
27075 root       10.0.0.227 20        0        0 S   0.00   0.00 kworker/u4:1
27169 root       10.0.0.227 20        0        0 S   0.00   0.00 kworker/0:0
  881 root       10.0.0.227 20    37976      760 S   0.00   0.10 rpc.mountd
  100 root       10.0.0.227  0        0        0 S   0.00   0.00 deferwq
  102 root       10.0.0.227  0        0        0 S   0.00   0.00 bioset
11876 root       10.0.0.227 20     9588     2572 S   0.00   0.34 bash
11852 root       10.0.0.227 20    95368     7352 S   0.00   0.97 sshd
  104 root       10.0.0.227  0        0        0 S   0.00   0.00 kworker/1:1H

When you take a look at the top, you’ll see CPU and memory statistics aggregated across the whole cluster.

root@vagrant:~# s9s process --top --cluster-id=1
PXC_Cluster_57 - 14:38:01                                                                                                                                                               All nodes are operational.
4 hosts, 7 cores,  2.2 us,  3.1 sy, 94.7 id,  0.0 wa,  0.0 st,
GiB Mem : 2.9 total, 0.2 free, 0.9 used, 0.2 buffers, 1.6 cached
GiB Swap: 3 total, 0 used, 3 free,

Below you can find the list of processes from all of the nodes in the cluster.

PID   USER       HOST       PR  VIRT      RES    S   %CPU   %MEM COMMAND
 8331 root       10.0.2.15  20   743748    40948 S  10.28   5.40 cmon
26479 root       10.0.0.226 20   278532     6448 S   2.49   0.85 accounts-daemon
 5466 root       10.0.0.226 20    95372     7132 R   1.72   0.94 sshd
  651 root       10.0.0.227 20   278416     6184 S   1.37   0.82 accounts-daemon
  716 root       10.0.0.228 20   278304     6052 S   1.35   0.80 accounts-daemon
22447 n/a        10.0.0.226 20  2744444   148820 S   1.20  19.63 mysqld
  975 mysql      10.0.0.228 20  2733624   115212 S   1.18  15.20 mysqld
13691 n/a        10.0.0.227 20  2734104   130568 S   1.11  17.22 mysqld

This can be extremely useful if you need to figure out what’s causing the load and which node is the most affected one.

Hopefully, the CLI tool makes it easier for you to integrate ClusterControl with external scripts and infrastructure orchestration tools. We hope you’ll enjoy using this tool and if you have any feedback on how to improve it, feel free to let us know.

The Galera Cluster & Severalnines Teams Present: How to Manage Galera Cluster with ClusterControl

$
0
0

Join us on November 14th 2017 as we combine forces with the Codership Galera Cluster Team to talk about how to manage Galera Cluster using ClusterControl!

Galera Cluster has become one of the most popular high availability solution for MySQL and MariaDB; and ClusterControl is the de facto automation and management system for Galera Cluster.

We’ll be joined by Seppo Jaakola, CEO of Codership - Galera Cluster, and together, we’ll demonstrate what it is that makes Galera Cluster such a popular high availability solution for MySQL and MariaDB and how to best manage it with ClusterControl.

We’ll discuss the latest features of Galera Cluster with Seppo, one of the creators of Galera Cluster. We’ll also demo how to automate it all from deployment, monitoring, backups, failover, recovery, rolling upgrades and scaling using the new ClusterControl CLI.

Sign up below!

Date, Time & Registration

Europe/MEA/APAC

Tuesday, November 14th at 09:00 GMT / 10:00 CET (Germany, France, Sweden)

Register Now

North America/LatAm

Tuesday, November 14th at 09:00 PT (US) / 12:00 ET (US)

Register Now

Agenda

  • Introduction
    • About Codership, the makers of Galera Cluster
    • About Severalnines, the makers of ClusterControl
  • What’s new with Galera Cluster
    • Core feature set overview
    • The latest features
    • What’s coming up
  • ClusterControl for Galera Cluster
    • Deployment
    • Monitoring
    • Management
    • Scaling
  • Live Demo
  • Q&A

Speakers

Seppo Jaakola, Founder of Codership, has over 20 years experience in software engineering. He started his professional career in Digisoft and Novo Group Oy working as a software engineer in various technical projects. He then worked for 10 years in Stonesoft Oy as a Project Manager in projects dealing with DBMS development, data security and firewall clustering. In 2003, Seppo Jaakola joined Continuent Oy, where he worked as team leader for MySQL clustering product. This position linked together his earlier experience in DBMS research and distributed computing. Now he’s applying his years of experience and administrative skills to steer Codership to a right course. Seppo Jaakola has MSc degree in Software Engineering from Helsinki University of Technology.

Krzysztof Książek, Senior Support Engineer at Severalnines, is a MySQL DBA with experience managing complex database environments for companies like Zendesk, Chegg, Pinterest and Flipboard.

Viewing all 327 articles
Browse latest View live