The majority of DBA’s perform health checks every now and then. Usually, it would happen on a daily or weekly basis. We previously discussed why such checks are important and what they should include.
To make sure your systems are in a good shape, you’d need to go through quite a lot of information - host statistics, MySQL statistics, state of backups, logs and so forth. Such data should be available in every properly monitored environment, although sometimes it is scattered across multiple locations - you may have one tool to monitor MySQL state, another tool to collect system statistics, maybe a set of scripts, e.g., to check the state of your backups. This makes health checks much more time-consuming than they should be - the DBA has to put together the different pieces to understand the state of the system.
Integrated tools like ClusterControl have an advantage that all of the bits are located in the same place (or in the same application). It still does not mean they are located next to each other - they may be located in different sections of the UI and a DBA may have to spend some time clicking through the UI to reach all the interesting data. This is why we introduced operational reports in ClusterControl 1.3 - which you can discover live next Tuesday during our release webinar.

The whole idea behind creating Operational Reports is to put all of the most important data into a single document, which can be quickly reviewed to get an understanding of the state of the databases.
![]() See the Operational Reports live in action during our release webinar
See the Operational Reports live in action during our release webinar
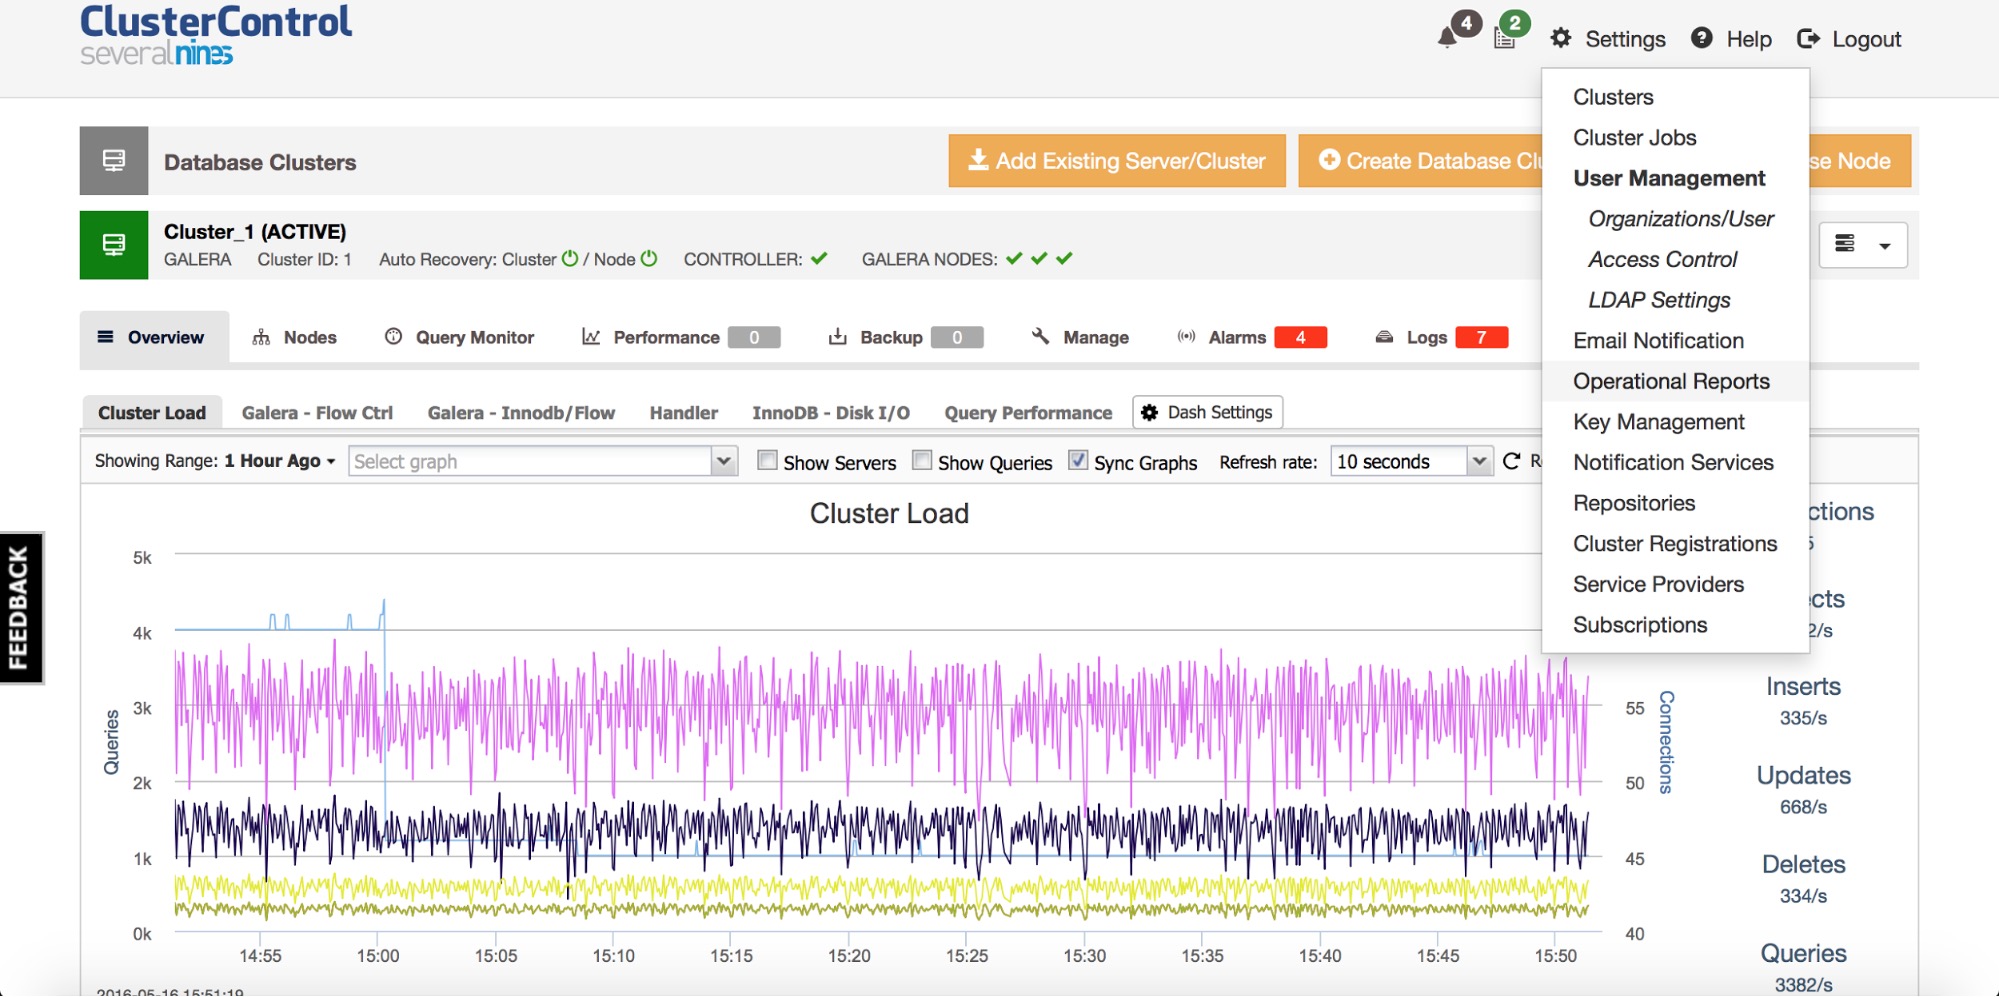
Operational Reports are available from the menu Settings -> Operational Reports.
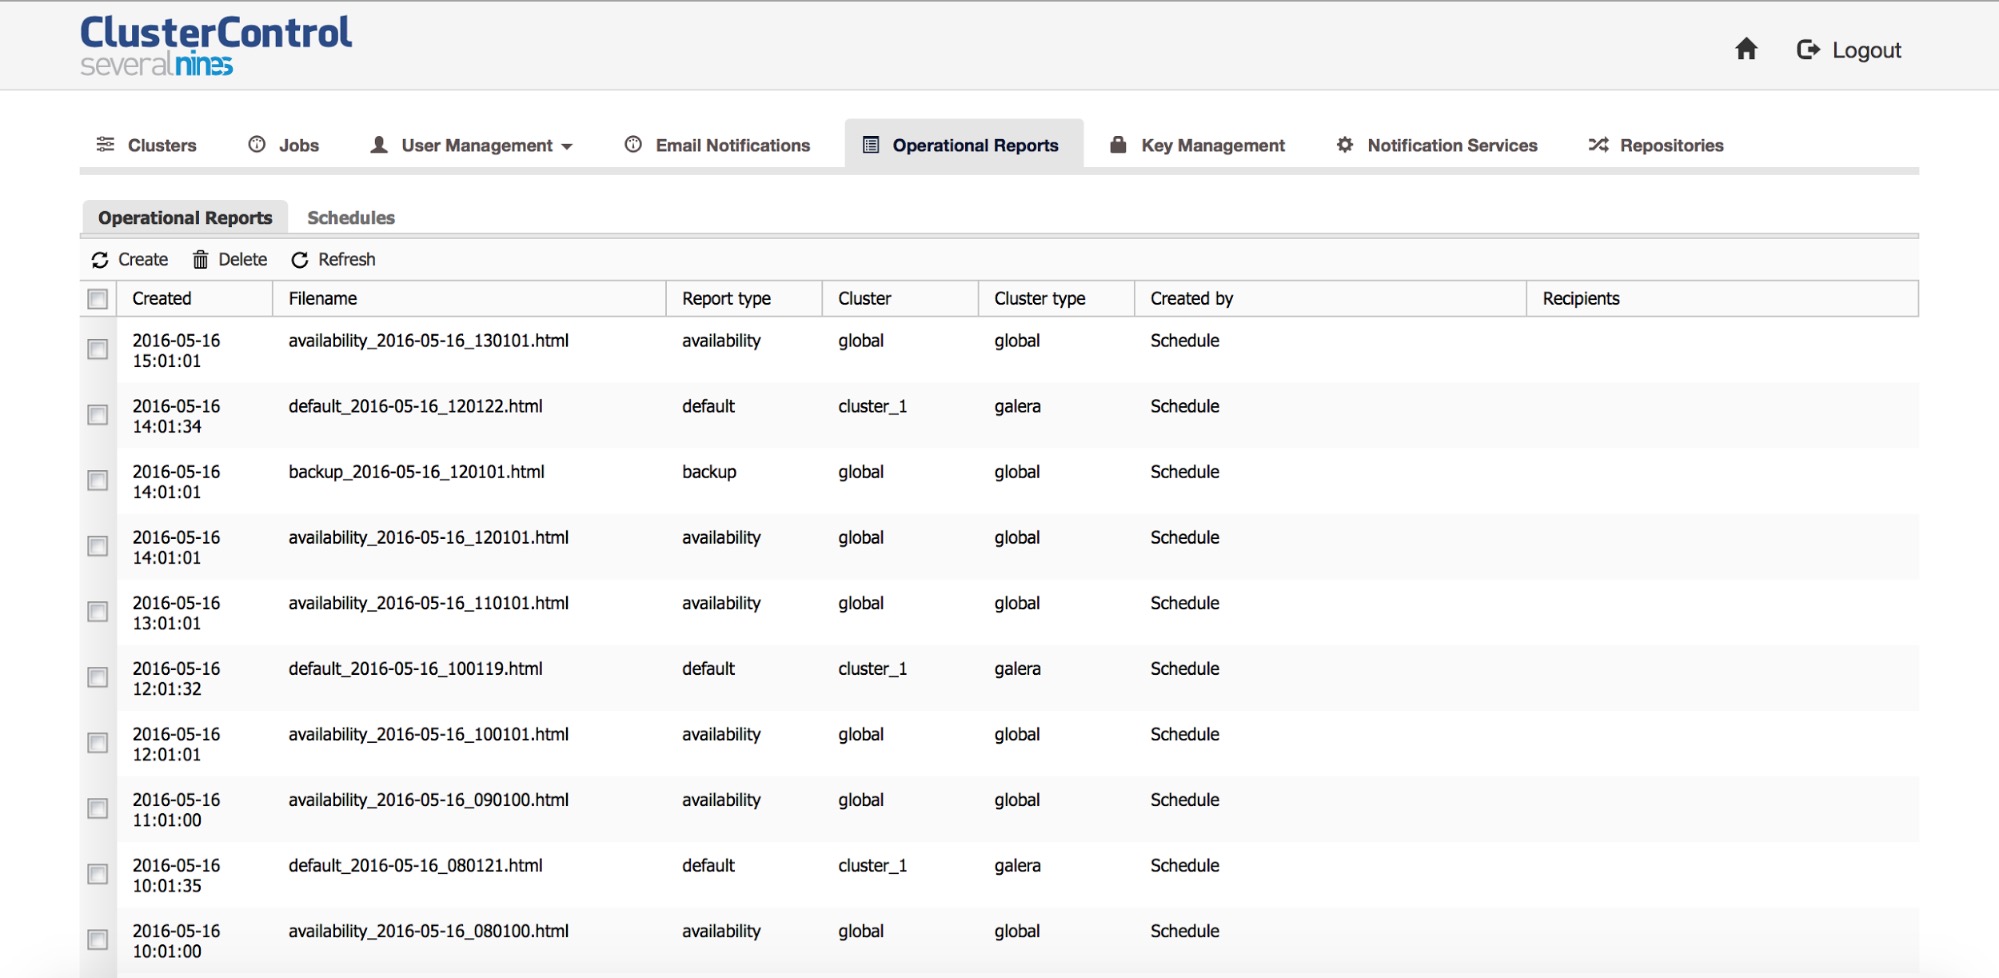
Once you go there, you’ll be presented with a list of reports created manually or automatically, based on a pre-defined schedule.
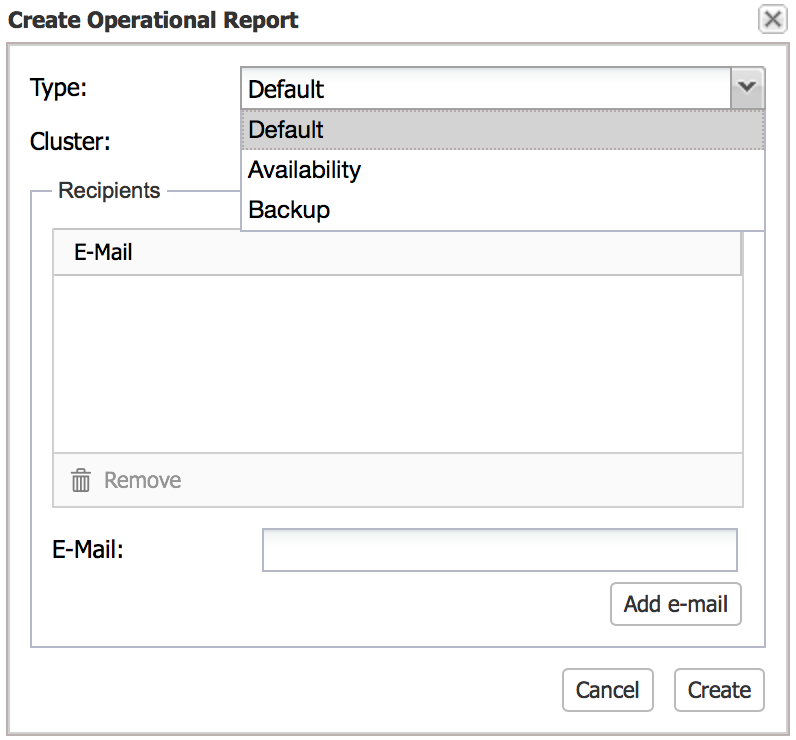
If you want to create a new report manually, you’ll use the ‘Create’ option. Pick the cluster, type of report, email recipients, and you’re pretty much done.
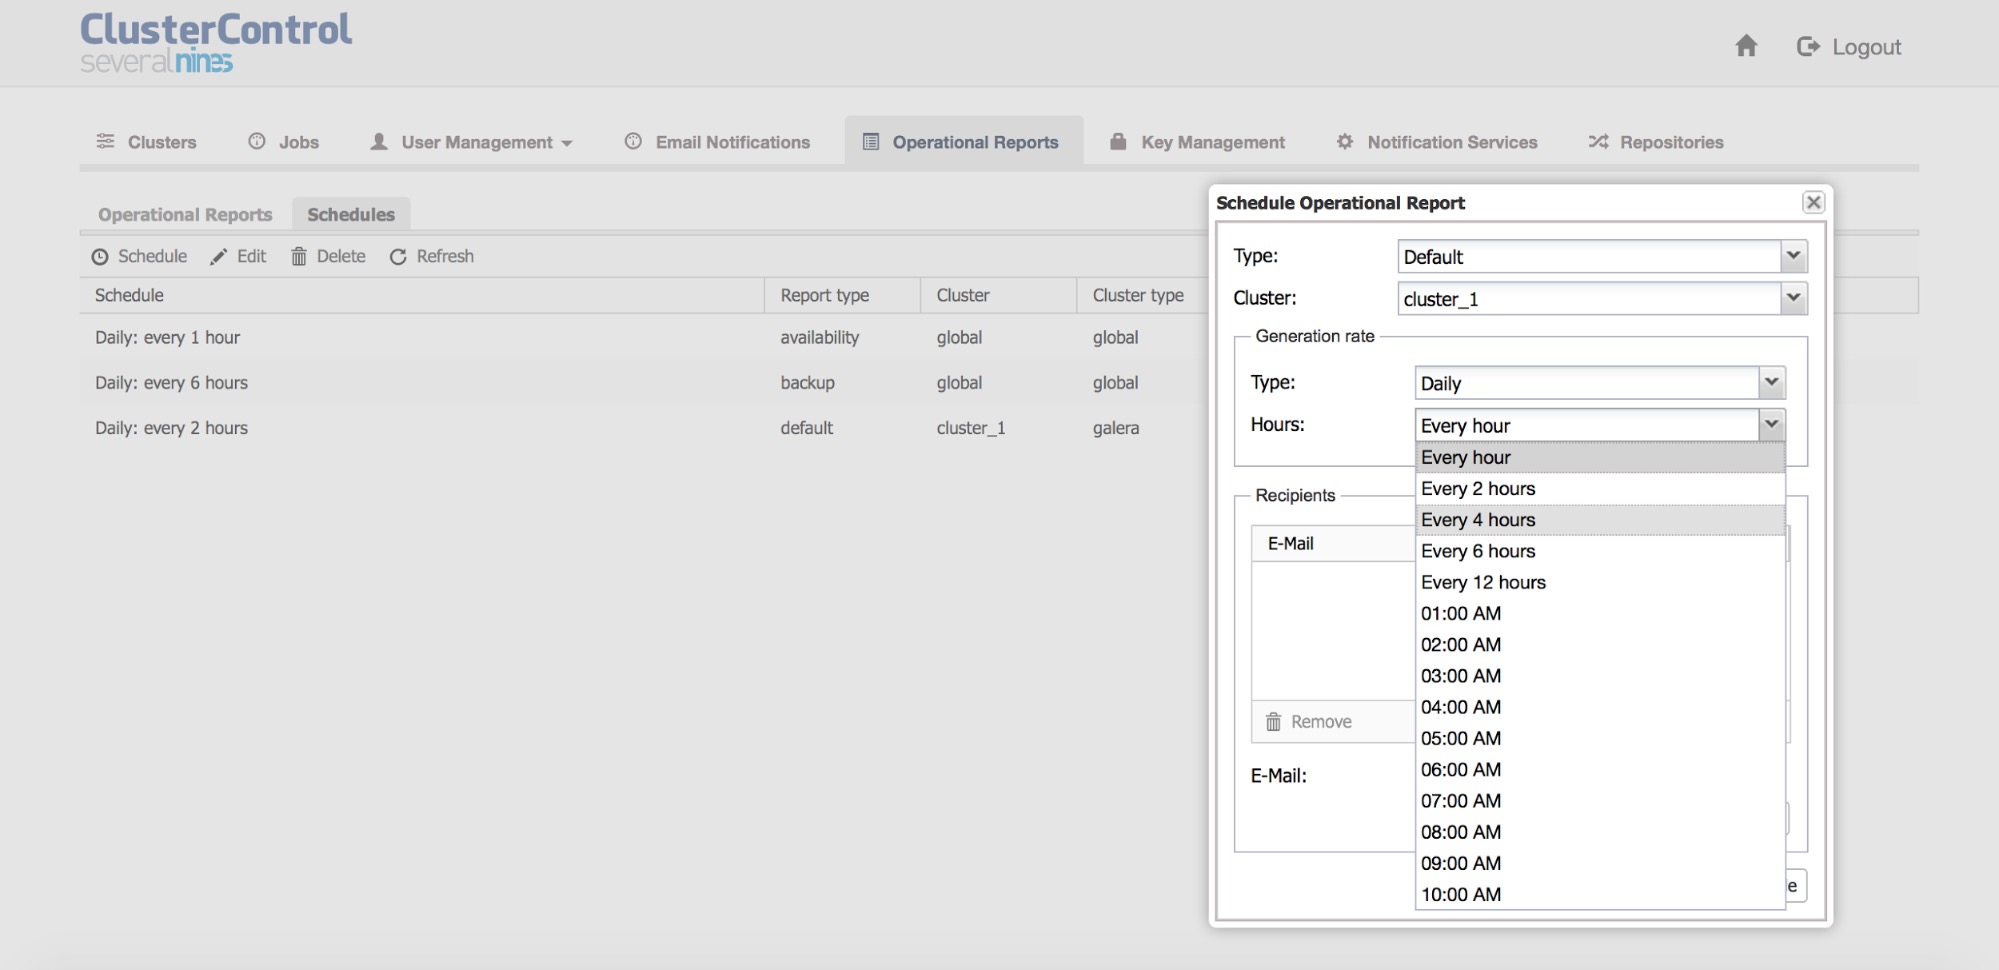
The reports can also be scheduled to be created on a regular basis.
At this time, three types of reports are available and we’ll show examples of these below.
Availability report
Availability reports focuses on, well, availability. It includes three sections. First, availability summary.

You can see information about availability statistics of your databases, the cluster type, total uptime and downtime, current state of the cluster and when that state last changed.
Another section gives more details on availability.
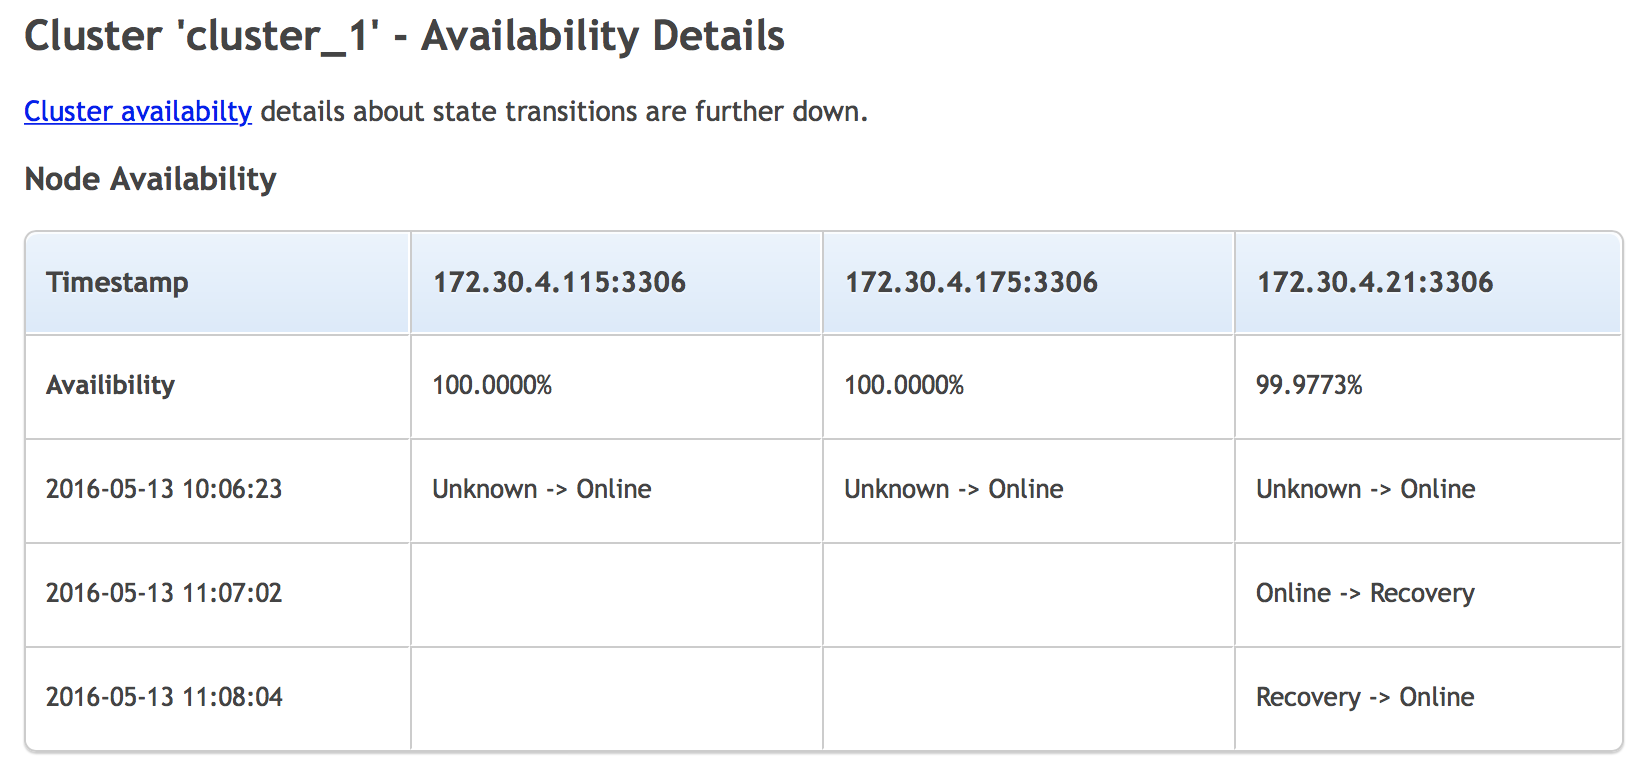
We can see when a node switched state and what the transition was. It’s a nice place to check if there were any recent problems with the cluster.
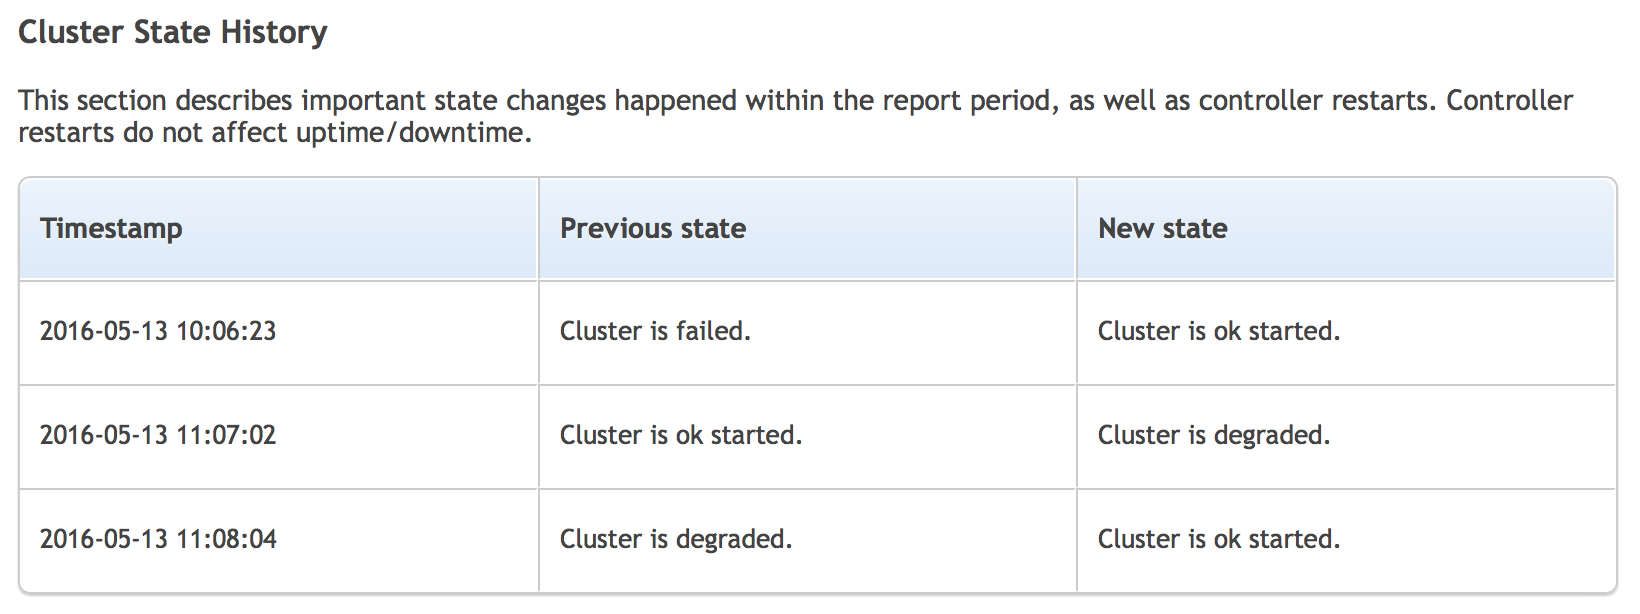
Similar data is shown in the third section of this report, where you can go through the history of changes in cluster state.
Backup report
The second type of the report is one covering backups.
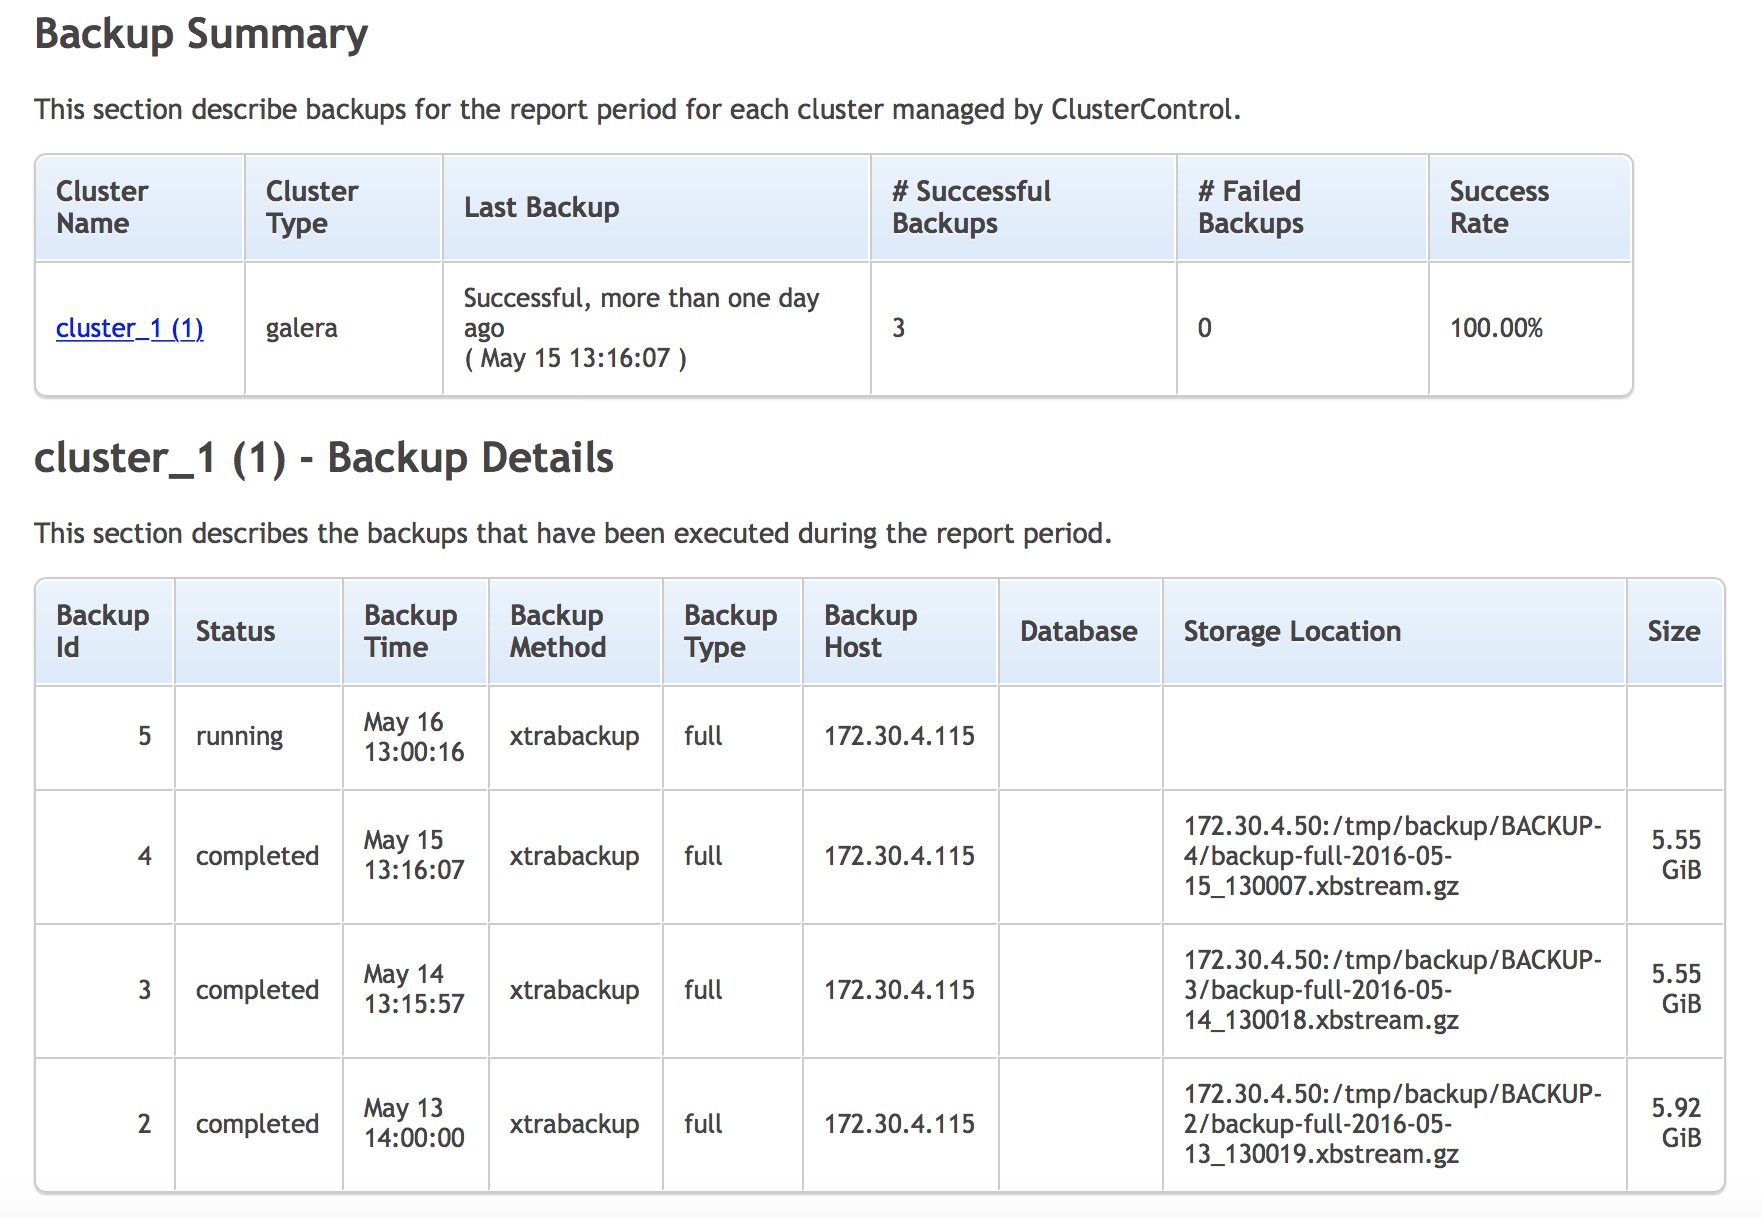
It contains two sections and basically gives you a short summary of when the last backup was created, if it completed successfully or failed? You can also check the list of backups executed on the cluster with their state, type and size. This is as close you can get to be certain that backups work correctly without running a full recovery test. We definitely recommend that such tests are performed every now and then.
Default cluster report
This type of report contains detailed information about a particular cluster. It starts with a summary of different alerts which are related to the cluster.

Next section is about the state of the nodes that are part of the cluster.
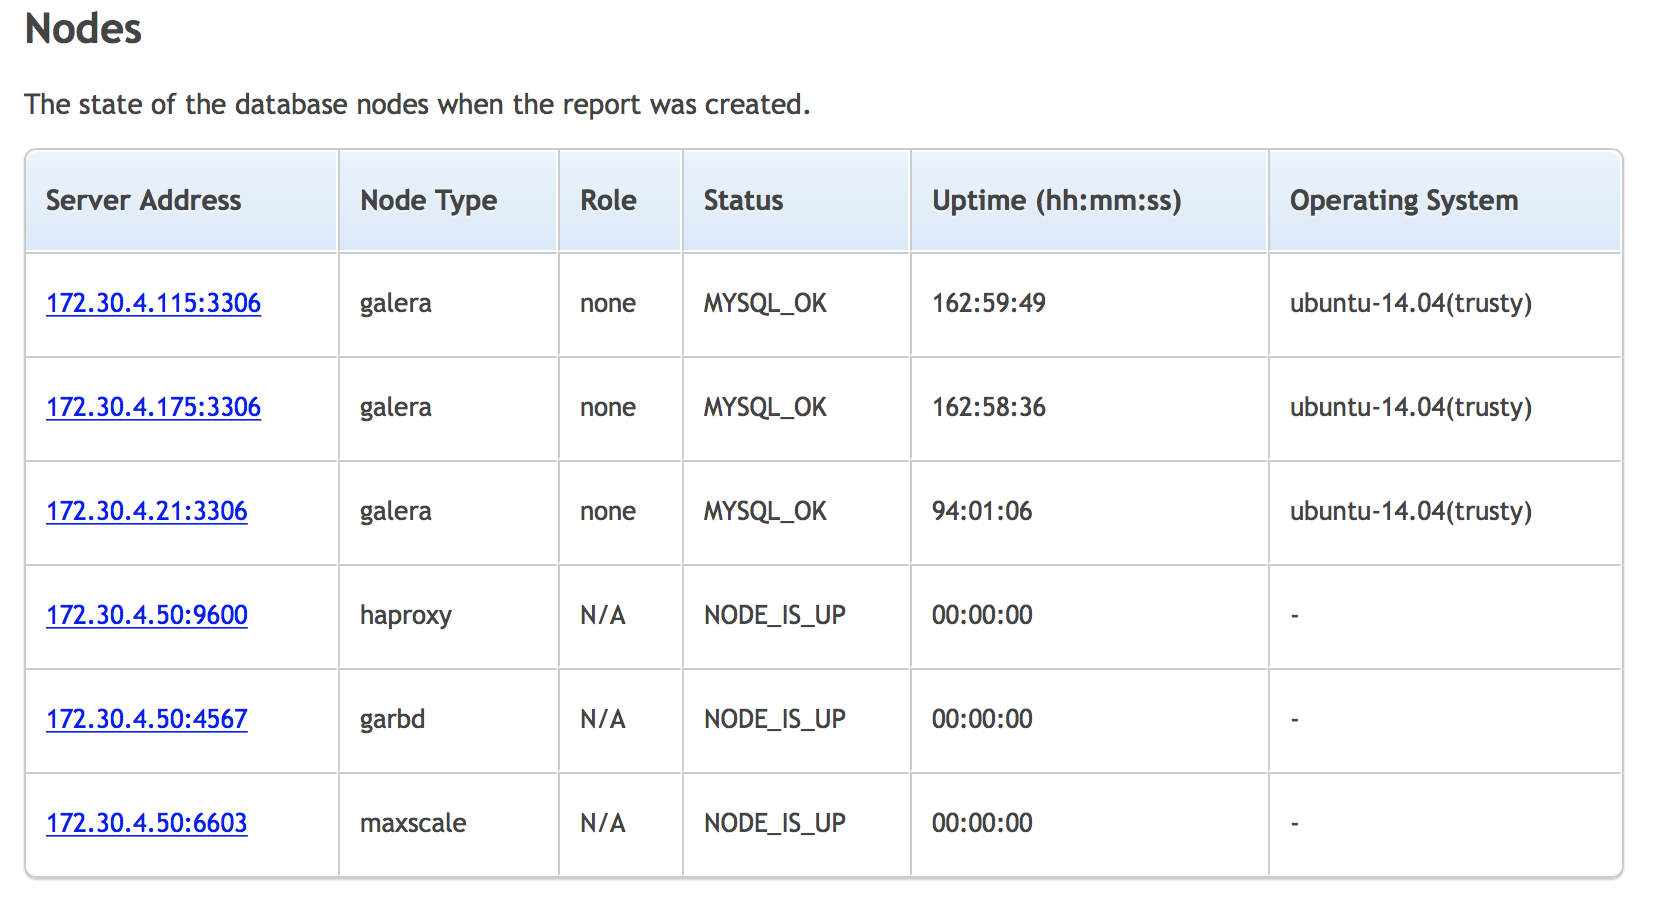
You have a list of the nodes in the cluster, their type, role (master or slave), status of the node, uptime and the OS.
Another section of the report is the backup summary, same as we discussed above. Next one presents a summary of top queries in the cluster.
Finally, we see a “Node status overview” in which you’ll be presented with graphs related to OS and MySQL metrics for each node.
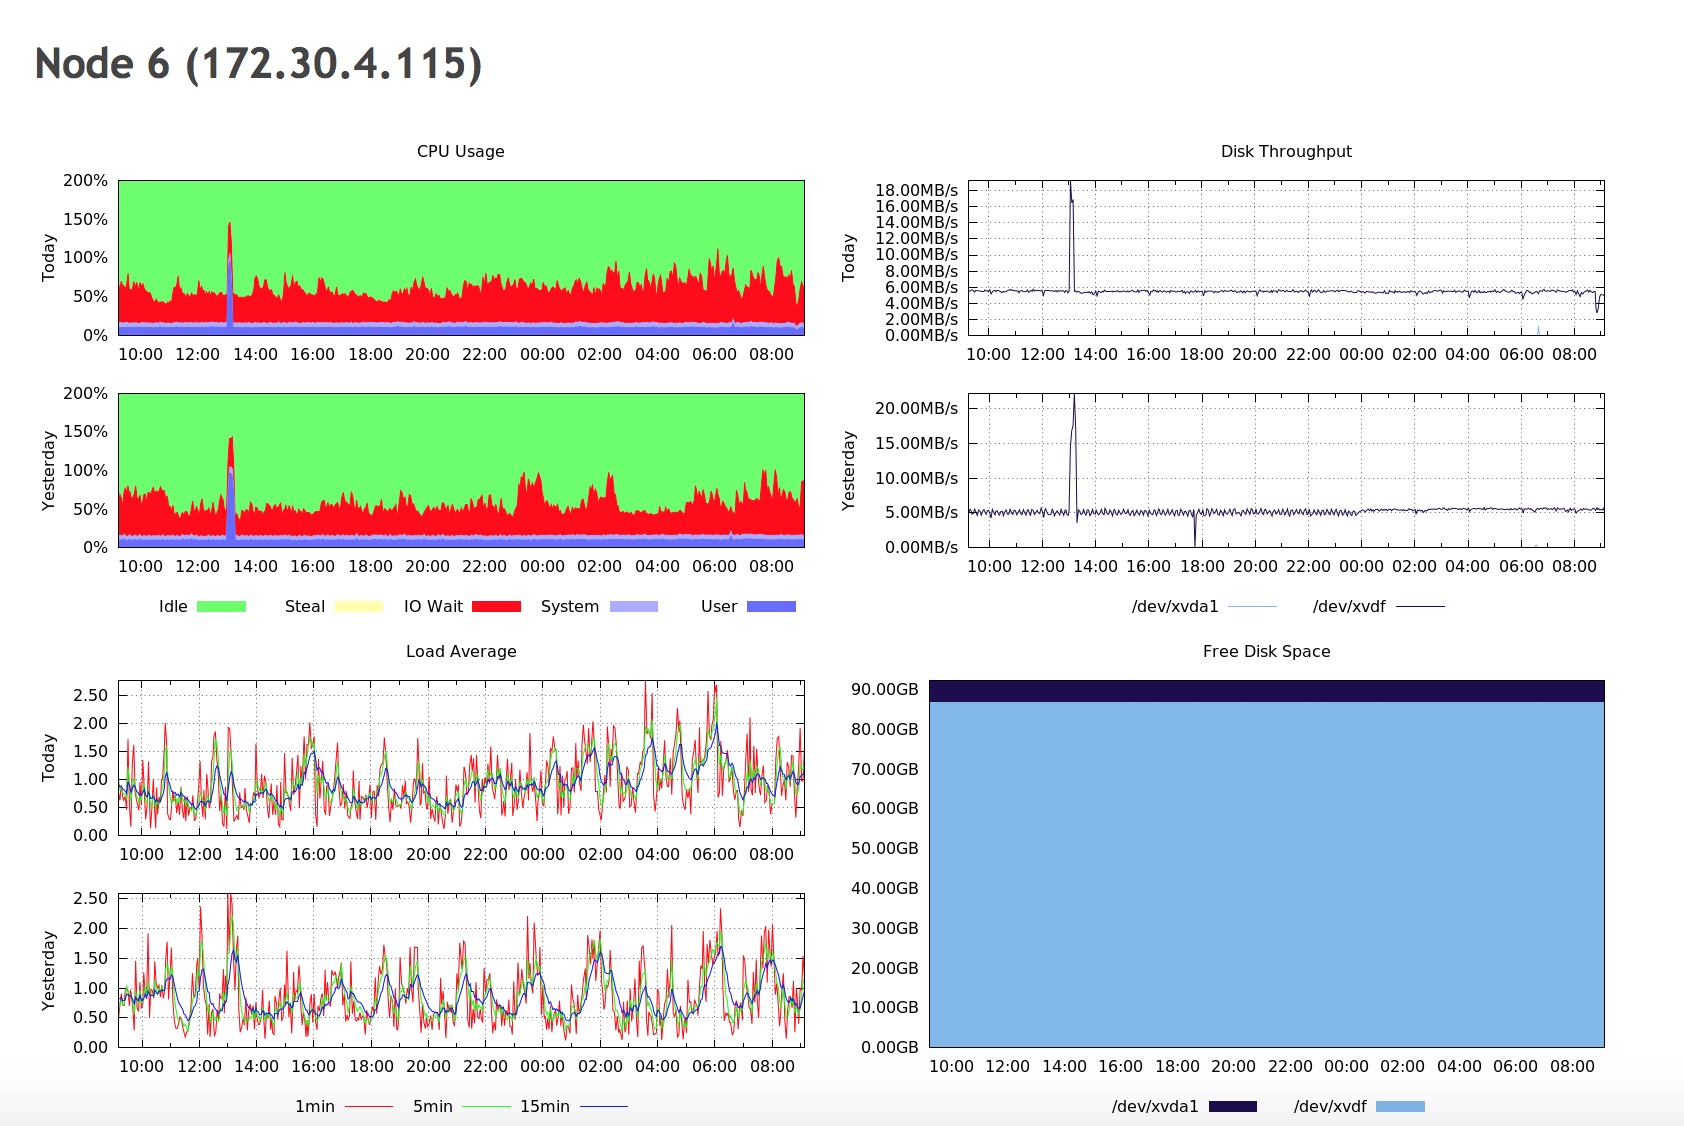
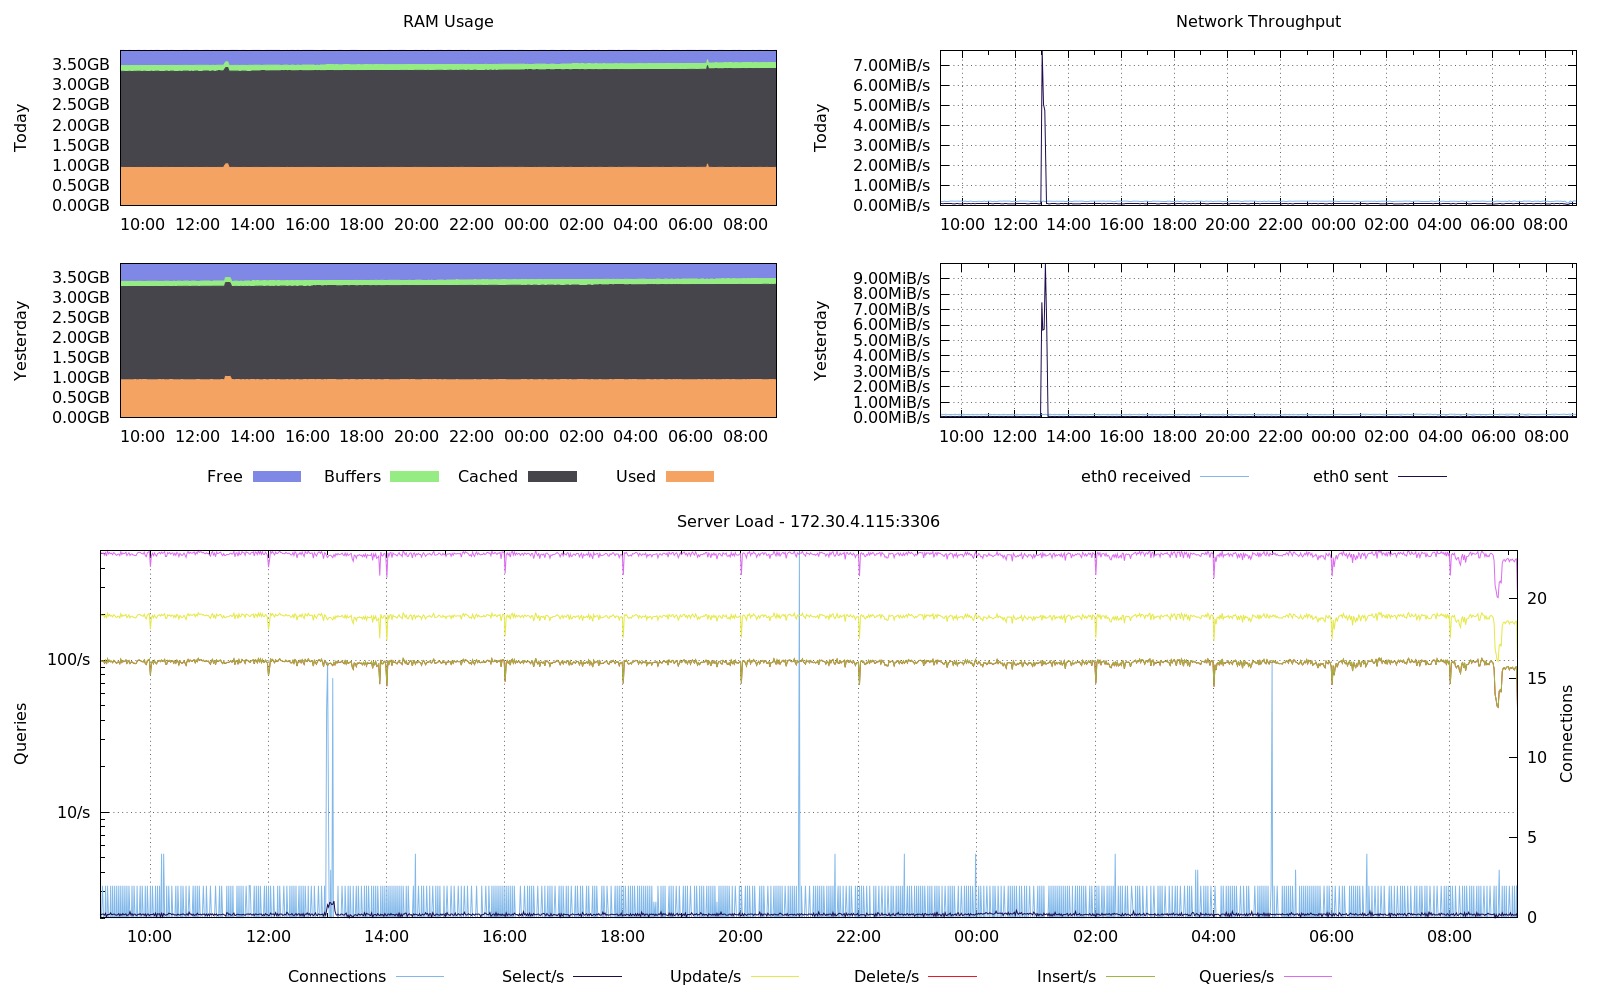

As you can see, we have here graphs covering all of the aspects of the load on the host - CPU, memory, network, disk, CPU load and disk free. This is enough to get an idea whether anything weird happened recently or not. You can also see some details about MySQL workload - how many queries were executed, which type of query, how the data was accessed (via which handler)? This, on the other hand, should be enough to pick most of the issues on MySQL side. What you want to look at are all spikes and dips that you haven’t seen in the past. Maybe a new query has been added to the mix and, as a result, handler_read_rnd_next skyrocketed? Maybe there was an increase of CPU load and a high number of connections might point to increased load on MySQL, but also to some kind of contention. An unexpected pattern might be good to investigate, so you know what is going on.
![]() See the Operational Reports live in action during our release webinar
See the Operational Reports live in action during our release webinar
This is the first release of this feature, we’ll be working on it to make it more flexible and even more useful. We’d love to hear your feedback on what you’d like to have included in the report, what’s missing and what is not needed.